Understanding Deliverability Metrics
Many email marketers are mistakenly assured in their ability to reach their recipients when they observe a high delivery rate. But what the “delivery rate” term actually means is the number of sent emails that did not return as a hard or soft bounce. In reality, a delivered email could end up in the Inbox, or spam box, or could get blocked.
You might be surprised if an email spam checker reports that your emails were filtered as spam. You’re not a spammer! You know the spam folder is not just for spammers. To protect their users from unsolicited email, mailbox providers evaluate different aspects of both the sender and the incoming message to determine whether or not it deserves to be in the Inbox.
Open rate, click-through rate, bounce rate, and complaint rate are basic metrics that email marketers have access to for measuring success. But did you know there is a lot of other metrics that are evaluated by mailbox providers and used to decide whether an email campaign should be sent to the Inbox or spam folder?
In this post, we’ll dig into the various email deliverability metrics to understand how mailbox providers distinguish a good email from a bad one, and we’ll debunk common deliverability myths to help you make sure your campaigns actually land in the Inbox.
Plus, we’ll share a live email deliverability test so that you could see your Inbox placement rate in real time.
1. Understanding Email Deliverability Metrics
Email marketers understand the importance of measuring different aspects of their email program, to determine its effectiveness and impact on the bottom line.
Metrics are often presented in the chronological order as far as the actions occur along the message journey. We’ll classify metrics differently, based on what information about your email program they deliver.
Thus, we divided 18 of the important deliverability metrics into three categories: Visibility, Insight, and Engagement.
#1. Metrics that Give You Visibility.
In this category, we placed the most basic metrics because they provide an overview of your email program and allow determining how “healthy” it is.
These metrics will show you general problems with your email program and list, and fixing them will be the first step towards better deliverability:
-
Email delivery rate:
Calculated by dividing the volume of emails delivered to the recipients by the volume of emails sent. It doesn’t necessarily mean your email landed in the Inbox, just that it didn’t bounce.
Example: 10,000 delivered emails ÷ 12,500 total emails sent * 100 = 80% delivery rate.
Do not confuse the delivery rate with the deliverability rate. The last one provides actual information on the number of emails that got exactly in the inbox. It is a complex metric influenced by many factors.
-
Bounce rate:
It’s the opposite of delivery rate. This is the percentage of email messages that failed to be delivered for any reason.
Example: 50 bounced emails ÷ 12,500 total emails sent * 100 = 0,4% bounce rate.
-
Open rate:
Ccalculated by dividing the number of emails opened by the recipients by the number of emails delivered. This metric is actually less accurate than you may think because an email is not registered as opened if a recipient opens it in a plain text format or does not load the images.
Example: 1000 opened emails ÷ 10,000 delivered emails * 100 = 10% open rate.
-
Click-through rate:
Calculated by dividing clicks by the volume of emails delivered. This metric is used to measure email engagement, but it does not actually give a clear picture.
Example: 500 clicked emails ÷ 10,000 delivered emails * 100 = 5% click-through rate.
-
Click-to-open rate:
calculated by dividing clicks by the volume of emails opened. This is the more accurate metric that demonstrates the recipient’s engagement and interest in your email content and offers.
Example: 500 clicked emails ÷ 1000 opened emails * 100 = 50% click-to-open rate.
#2. Metrics that Give You Insight.
Moving forward, let’s consider the “Insight” metrics. They provide a deeper analysis of your email program and give you more sophisticated insights into your email deliverability.
Some of these metrics precise the “Visibility” metrics, while others can help you uncover the reasons behind email performance issues.
-
Hard bounce rate:
Hard bounced are messages that are rejected due to permanent issues with the recipient’s mailbox (e.g., invalid email address or domain).
Example: 25 hard bounced emails ÷ 12,500 total emails sent * 100 = 0,2% hard bounce rate.
-
Soft bounce rate:
Soft bounced are messages that are rejected due to temporary issues with the recipient’s mailbox or server (e.g., a mailbox is full or server is not responding).
Example: 10 soft bounced emails ÷ 12,500 total emails sent * 100 =0,08% soft bounce rate.
-
Rejected or mail block rate:
Rejected email is a subset of bounced email, but it includes only those messages that failed to get delivered due to reputation or content issues (e.g., complaints, spam trap hits, IP blacklisting, spam looking content).
Example: 10 rejected/blocked emails ÷ 12,500 total emails sent * 100 =0,08% rejected/blocked rate.
-
Complaint rate:
Complaints are a strong negative indicator that your emails are unwanted. It is calculated by dividing the number of complaints to the number of delivered emails. You need to sign up for feedback loops with ISPs that provide this service to be notified about complaints.
Example: 10 complaints ÷ 10,000 delivered emails * 100 = 0,1% complaint rate.
-
Spam trap hit rate:
Spam traps are a strong indicator that you are sending to a low quality purchased or harvested list. Spam trap addresses are not disclosed so no email verifier or email service provider will report you spam trap addresses.
However, Microsoft’s Smart Network Data Services (SNDS) will give you the information about the traffic originating from your IP address such as the volume of sent emails, complaint rates, and spam trap hits. You can then use this information to determine the cause of issues and take the appropriate action to correct the problem. You can get your Hotmail and Outlook.com SNDS report here.
-
Inbox placement rate:
Inbox placement rate is a far more accurate metric than the delivery rate because it measures the percentage of sent emails that actually landed in the recipient’s Inbox. While email service providers do not show your Inbox placement rate, there are testing tools like GlockApps that will help you estimate your potential Inbox rate by sending a copy of your message to the seed list. Ideally, you should strive for an 80+% Inbox placement rate. Everything that is below is considered bad Inbox deliverability.
-
Spam placement rate:
Calculated as the number of emails delivered to the spam folder out of total emails sent. Obviously, the lower your spam rate, the better. A low spam placement rate shows you’re a good sender and your emails are wanted. A sudden boost in spam placements could indicate an issue with a particular campaign, or your entire email program.
If your spam placements are high, check your sending infrastructure (sender IP and email/domain reputation, authentication, sender score) and message content (links and images from blacklisted domains, other elements that add spam points). If they are in order, the problem must be in the negative recipient engagement.
#3. Metrics that Tell You about Engagement.
Big mailbox providers like Microsoft, Google, Yahoo!, and AOL apply engagement based email filtering to better protect their users from unwanted emails and ensure the delivery of “good” emails to the Inbox.
Thus, we put the most advanced — and often most valuable — metrics into the “Engagement” category. These metrics provide the real picture of whether or not subscribers are engaged with your brand, as well as the level of their engagement.
Some of the “Engagement” metrics are available in the reports provided by ESP while others are measured on the mailbox provider side and available to marketers using 3rd party tracking tools only.
Properly interpreted, “Engagement” metrics can help you carry out a deep analysis of your email campaign, like the effectiveness of the sending time and message content, design, subject, call-to-action, offers.
-
Read rate:
Calculated as the number of emails marked as “read” out of all emails sent. Read rate is similar to open rate, but it is far more accurate because it takes all viewed emails into account, regardless of image rendering. The quality of your subject lines and sending time typically have the biggest influence on the read rate, but deliverability issues can also be the cause of a sudden decline of emails that were read.
-
“Deleted before reading” rate:
Calculated as the total number of unread emails deleted out of total emails sent. A high “deleted before reading” rate is an indication of a failed campaign. A consistent high “deleted before reading” rate tells about list acquisition or management issues or about lost interest in your overall email program, and can result in future emails being filtered to the spam folder.
-
“This is not spam” rate:
Calculated as the number of times a subscriber marks the message as not spam out of the number of emails delivered to the spam folder. This metric is a powerful indicator of subscriber engagement and a strong positive indicator to mailbox providers that your emails are wanted. There are two scenarios behind a low “this is not spam” rate: 1) a low “this is not spam” rate can indicate high Inbox deliverability so that only a few of your emails were sent to the spam folder and 2) a low “this is not spam” rate with a high percentage of mail being sent to spam indicates a lack of interest from your subscribers.
-
“Replied to” rate:
Calculated as the number of replies to your email out of the total of emails sent. There is no “replied to” rate you should try to achieve and having a low or zero “replied to” rate won’t necessarily hurt your deliverability. However, a high “replied to” rate can help as it is a very strong positive signal of engagement showing mailbox providers that the email message was likely desired, and increases the chance of future campaigns for being sent to the Inbox of that particular subscriber.
-
Unique clicks and unique open rate (UOR):
Calculated as the number of unique clicks/opens divided by the total amount of clicks/opens. Unique click/open means that if a recipient clicked or opened the same email several times, only one opening will be counted as unique, but several total opens.
-
Sharing and forwarded rate:
Calculated as the number of the emails that the recipients forwarded and/or shared with others out of total emails sent. This metric is useful to assess the virality of your email. A high forwarded rate is a sign of strong subscriber engagement with the content you’re sending and indicates that the content is relevant to not only your subscribers but also to their networks.
-
Unsubscribe rate:
Calculated by dividing the number of unsubscribes by the number of emails delivered. The unsubscribe rate should be considered in conjunction with other metrics such as Inbox placement and spam placement rate because it can indicate different situations. On one side, a declining unsubscribe rate can result from a higher engagement which is a positive sign. On the other side, it can result from a decreasing Inbox placement rate which is a negative signal and should be addressed.
For additional insights, consider evaluating the relationships that exist between certain metrics:
-
Total vs. unique:
Metrics like opens and clicks can be divided into “total” and “unique” to provide a more accurate measure of the subscriber’s activity. The ratio of total opens/clicks to unique opens/clicks can also provide useful insights into engagement levels.
-
Unsubscribes vs. complaints:
If complaints are higher than unsubscribes, this could tell about potential issues with your opt-out process.
-
“Good” clicks vs. “neutral” clicks:
The total number of clicks can be misleading if a high percentage of clicks are for non-offer links like “About Us”, “Privacy Policy” or “Terms & Conditions.”
Viewing the deliverability metrics of one isolated campaign provides little value. You’ll get more insights into the overall health of your email program if you measure individual campaigns against other campaigns and measure your overall email program over a specific period of time (e.g., from year to year, from quarter to quarter).
However, you should be aware that different aspects of the company’s email program bring different results. Thus, different types of campaigns (transactional vs. building relationship vs. re-engagement) have different average open and click rates so the success of a particular campaign should be measured with regards to its specific.
2. Debunking Email Deliverability Myths
Email deliverability is a very tricky concept in email marketing and many marketers labor under a delusion as to how effectively their email program works. To remove the mystery from the most deceptive aspects of email deliverability, we’re going to debunk 5 most common deliverability myths in chapter 2.
Here’s the deal:
Myth #1. My “delivered” rate tells how many emails were delivered into the Inbox.
The truth is:
The delivered rate doesn’t actually show how many emails were sent to the Inbox. It simply tells you how many of your messages did not bounce. The delivered rate includes Inbox placements, spam/junk box placements, and emails blocked without a bounce.
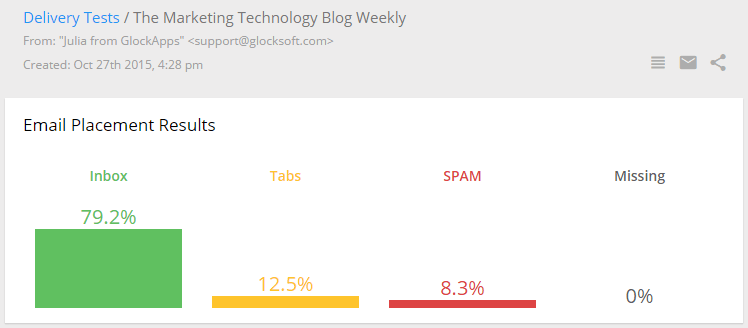
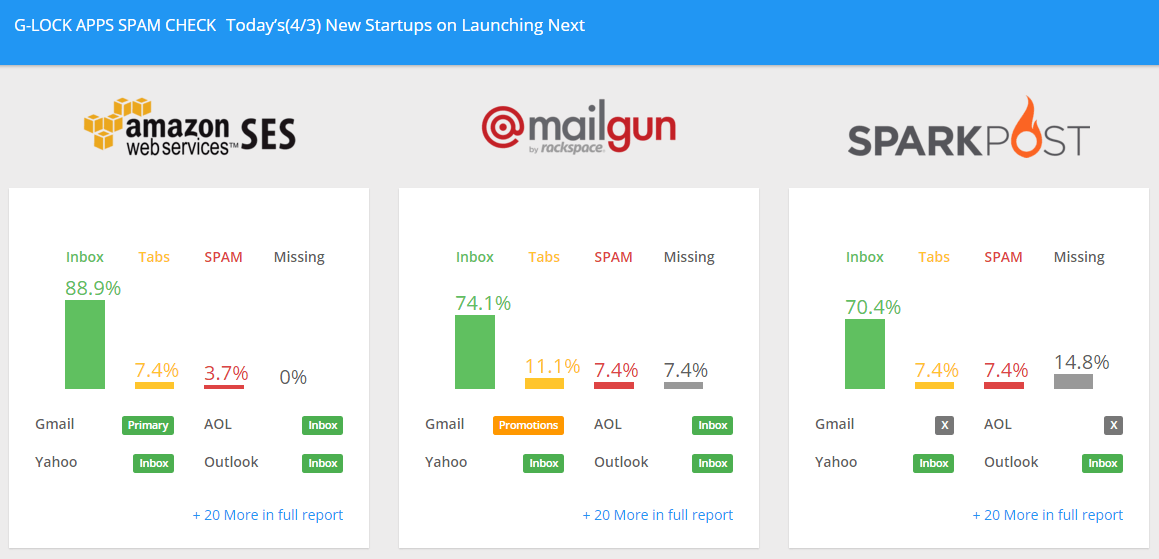
For example, the screenshot below demonstrates a report with the 100% delivery rate (0% missing i.e. bounced emails), but the deliverability rate is 91,7% (Inbox rate + Tabs rate).
Thus, rather than looking at the delivered rate, look at the Inbox placement rate to estimate the performance of your email campaign. Follow email list management best practices and send relevant and engaging messages at the optimal time to land in the Inbox.
Myth #2. A lot of my emails go to spam – it’s the fault of my email service provider.
The truth is:
Sure, your email service provider or delivery vendor is responsible for deliverability to a certain degree. If their sending infrastructure isn’t set up properly, or they gave you an IP address with a poor reputation, this may negatively impact your ability to deliver emails to the Inbox. But these scenarios are the exception, and not the rule.
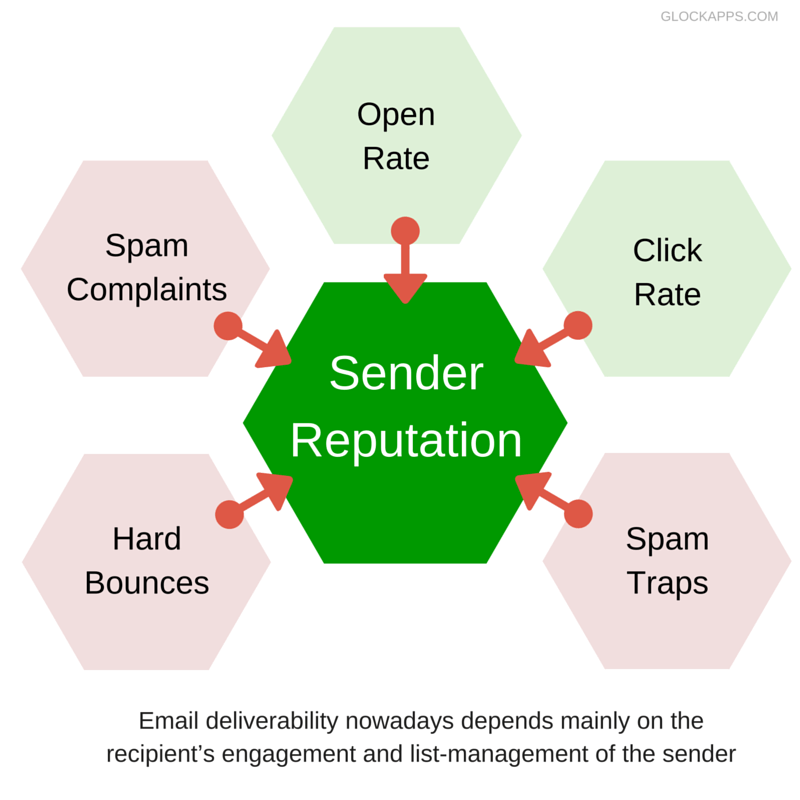
Whether or not your emails will be delivered to the Inbox mostly depends on your sender reputation which is determined by the quality of your lists, complaints, bounces, subscriber engagement, email/domain reputation — all of them are under your control.
And if you don’t fix the root cause of your poor reputation, no email service provider or delivery vendor can help you get your emails delivered to the Inbox.
Myth #3. If I have a high Sender Score, all my emails will go to Inbox.
The truth is:
Sender Score is just an indication of your Inbox potential, nothing else. It indicates the level of trustworthiness of your IP address to a mailbox provider or filtering system.
According to senderscore.org, “email senders with a Sender Score below 70 typically experience aggressive email filtering applied to every email coming from the IP address attached to the Sender Score. Email senders maintaining a Sender Score above 70 typically see filtering criteria applied to individual emails and email campaigns instead of entire IP addresses.”
Eventually, the Sender Score is only one of many aspects mailbox providers consider when filtering, blocking or delivering your emails to the Inbox.
Myth #4. If I have a low complaint rate, my emails should be sent to the Inbox.
The truth is:
Of course, complaints do matter. But they are only one of the factors that go into understanding your deliverability. You could have a low complaint rate and at the same time a lot of your emails could be delivered to the spam folder just because of poor email/domain reputation, missing authentication and/or IP blacklisting issues.
As the concept of email deliverability is more complex than you can think of it, you’ll need to follow best email marketing practices throughout the whole email program focusing on the metrics that can positively affect your Inbox placement rates.
Myth #5. I have to avoid words like “free” or “money” and symbols like the exclamation mark because they trigger spam filters.
The truth is:
Nowadays, content does not matter as much as it was before because content spam filters are easy for spammers to trick. In the modern world, mailbox providers and spam filtering systems evaluate your sending reputation and recipient engagement when making Inbox and spam folder placement decisions.
If you have a good reputation, in most cases your reputation will beat any content issues. But that doesn’t mean that content issues should be ignored completely. Some elements in the content such as broken HTML, low text ratio vs. high image ratio, links from blacklisted domains still add points to the message spam score and should be corrected.
So while content can still influence deliverability, emails filtered as spam are not necessarily the result of the content itself.
If you’re not sure whether or not your content is triggering spam filters, use a tool like GlockApps to test the email against the major spam filters like SpamAssassin, Google Spam Filter and Barracuda that will determine certain keywords, URLs, or HTML elements in your content that can lead to deliverability problems.
For more information, check these best practices to maximize the Inbox delivery.
Now here’s the kicker:
3. Test Deliverability Before Sending to the Whole List
Testing email deliverability using a testing tool such as GlockApps will help you identify potential filtering issues before you send.
Within minutes, GlockApps will show you where your email is placed at different ISPs.
To generate the report, we’ll re-send your email through our personal accounts with Amazon SES, SendGrid, and Mailgun to the control list of email addresses (seed list).
But you should be aware that the deliverability may be different when you send emails through your SMTP server, delivery service or email service provider.
To test deliverability through YOUR sending infrastructure, you’ll need to create an account on GlockApps.
In your personal account, you’ll be able to create new tests and we’ll show you in real-time if there are any problems with YOUR sending system and message.
So, quick-test your email using the live test below and you’ll find the “Create My Account” button in your quick report.
Related Posts
In today’s world of electronic mail, the vast majority of messages are sent in an HTML format rather than plain Read more

Are you looking for the best email marketing affiliate program? Seize the opportunity and become a partner of GlockApps, the Read more

In healthcare, protecting patient information is a top priority, especially regarding electronic communications. HIPAA-compliant email service providers are critical in Read more
In an attempt to secure their users from unwanted email communications, Internet service providers (ISPs) update their email filtering rules Read more
Comments
Hi Julia,
That was a great read. Very informative. Thanks very much.
I’ve just created an account in G-Lock apps. Superficially, it seems that my email delivery rate isn’t so bad. (I’ve sent my first email with your program this Saturday.)
However, now I’d like to access all the other metrics that you mention. Where can I find those?
Hi Jacqueline,
Some metrics such as a bounce rate and unsubscribe rate, you can see in our email marketing software G-Lock EasyMail7 if you are using it to send emails.
Some metrics such as an open rate, click rate, click-through rate, forwarded rate, and read/skimmed/glanced rate can be tracked with our email tracking system G-Lock Analytics from glockanalytics.com.
The Inbox placement, tabs placement, and spam placement rates are determined by G-Lock Apps.
And the metrics such as a “replied-to” rate, spam markings, and not spam markings are not available for senders. These are internal metrics that mailbox providers monitor and evaluate to decide how to treat future emails from the sender.