New Report: Email Deliverability Statistics Q1 2024 – Exploring the Impact of Gmail and Yahoo Updates [+PDF Inside]
Table of contents
- Email Deliverability Statistics Q1 2024: Email Delivery Rates per Senders (ESPs)
- Email Deliverability Statistics Q1 2024: Email Delivery Rates per Mailbox Providers (ISPs)
- Email Deliverability Statistics Q1 2024: Email Delivery Rates per Value
- Email Deliverability Rate Q1 2024: 1 – 10,000 Emails per Month
- Email Deliverability Rate Q1 2024: 10,001 – 50,000 Emails per Month
- Email Deliverability Rate Q1 2024: 50,001 – 200,000 Emails per Month
- Email Deliverability Rate Q1 2024: 200,001 – 1,000,000 Emails per Month
- Email Deliverability Rate Q1 2024: 1,000,000+ Emails per Month
- The Takeaway
In an attempt to secure their users from unwanted email communications, Internet service providers (ISPs) update their email filtering rules and introduce new standards for email senders. From one side, it makes the recipients’ life easier; from the other side, it requires a more thoughtful approach to email campaigns from senders.
Email deliverability testing is now an integral part of an email sending program for a lot of organizations. Not only does deliverability testing reveal issues that lead to low Inbox placement and response rates, when done regularly it also allows to catch the issues before they have a serious impact on the sender reputation.
At GlockApps, we’ve made hundreds of thousands of email tests for a variety of email service providers; and the number of the users is growing as more and more senders realize the importance of deliverability testing.
What is a good Inbox placement rate? Our customers often ask this question when we speak in live chats or on demo calls. The answer is simple: the higher, the better. Simply put, the more providers place your emails in the Inbox, the better things are for you. However, it also depends on each sender’s preferences and needs how to estimate the results.
Here we shared email deliverability statistics for 2023. Considering the updates of the filtering algorithms and email sender best practices, we decided to see how the email deliverability changed in the beginning of 2024 compared to the last months of 2023.
Below we are sharing average email deliverability rates for the 1st quarter of 2024 calculated based on email tests made by the GlockApps users.
Email Deliverability Statistics Q1 2024: Email Delivery Rates per Senders (ESPs)
Does Google still rule the world? Did the percentage of senders using Outlook increase? Is Mailgun as popular as before?
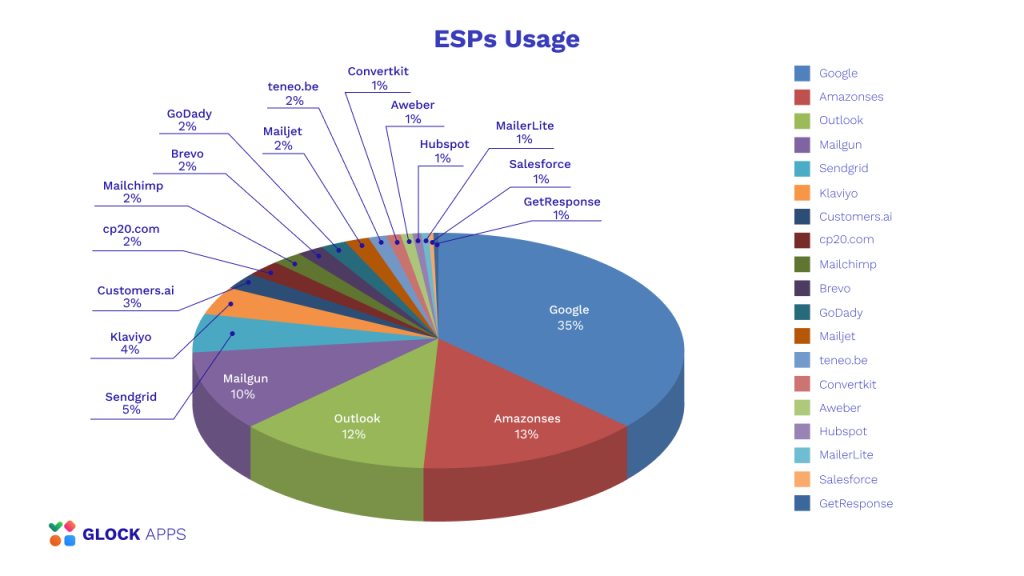
We want to start by sharing the information about the most popular email service providers (ESPs) that GlockApps customers were using to test their email messages and the delivery rates shown by these ESPs.
According to our data, the top five ESPs among the GlockApps users in the 4th quarter of 2023 were
- Google – 41%
- Mailgun – 13%
- Outlook – 13%
- Amazon SES – 7%
- SendGrid – 5%
The statistics collected during the 1st quarter of 2024 provides these numbers:
- Google – 37%
- Amazon SES – 14%
- Outlook -12%
- Mailgun – 10%
- SendGrid – 5%
With that said, Google is still the most popular email service provider. The percentage of senders using Amazon SES increased by 2 times while the numbers for Outlook, Mailgun, and SendGrid didn’t change much.
Now let’s examine the statistics on the average delivery rates for different ESPs to see which ones sent more emails to the Inbox in the 1st quarter of 2024.
According to our email tests, the top ten ESPs with the highest Inbox placement rate are:
| ESP | Inbox Average (%) | Spam Average (%) |
| Mimecast | 76,8 | 4,6 |
| AWeber | 58,1 | 9,4 |
| Hubspot | 57,0 | 14,6 |
| Klaviyo | 56,9 | 15,7 |
| Amazon SES | 54,9 | 12,7 |
| GoDaddy | 54,1 | 18,8 |
| Mailgun | 53,8 | 16,9 |
| MailChimp | 51,9 | 19,0 |
| Mailjet | 51,7 | 14,0 |
| Dotmailer | 50,6 | 20,2 |
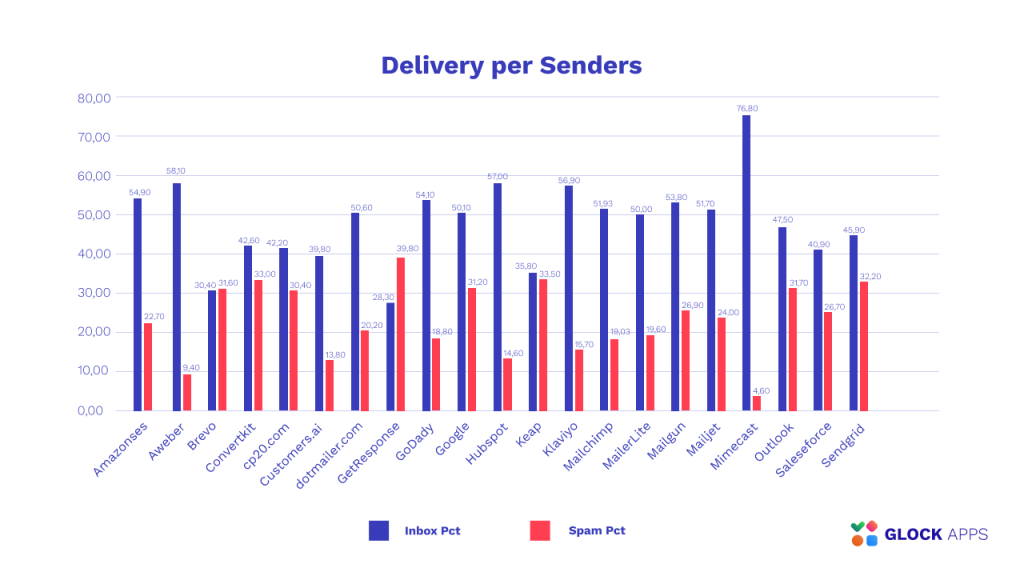
The interesting fact is that Google with its 50,1% average Inbox rate is beyond the top ten ESPs with the highest deliverability. From our observation, Google email accounts are widely used for sending cold outreach emails. Cold emails used to get worse user engagement, which could lead to a higher Spam placement rate.
Email Deliverability Statistics Q1 2024: Email Delivery Rates per Mailbox Providers (ISPs)
Now let’s examine the data about the average email delivery rates for the most popular mailbox providers (ISPs). It is to note that this data doesn’t take an email service provider used, the value of emails sent, or the type of email messages (marketing, promotion, subscription, or cold outreach) into account.
In order you can better understand the changes in the average delivery rates compared to the last months of 2023, we summarized everything in the tables below.
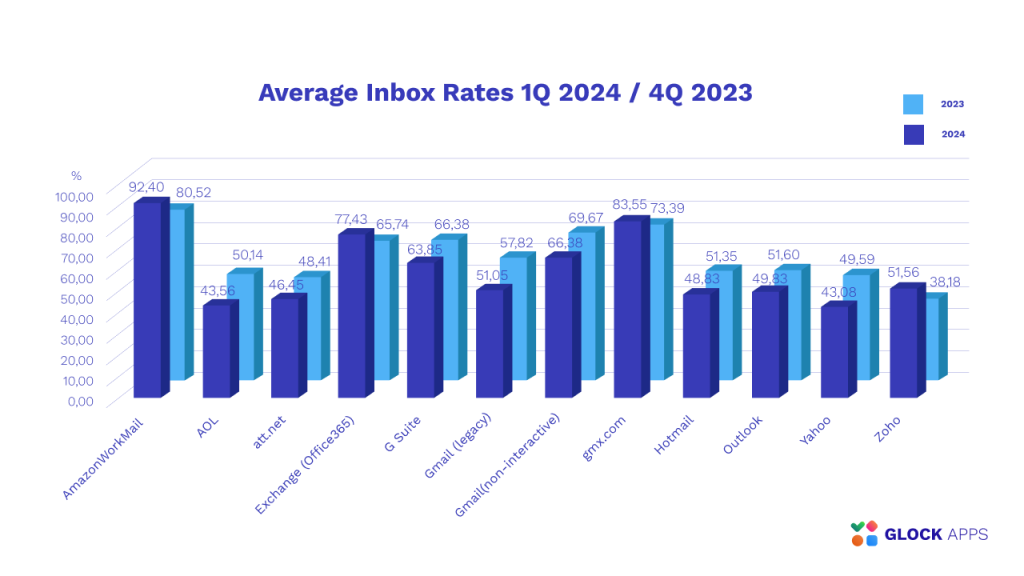
Email Deliverability Statistics: Inbox Placement Rates per ISP: Q1 2024 vs Q4 2023
Below is the comparison chart for the average INBOX placement rates for the 4th quarter of 2023 and the 1st quarter of 2024.
| ISP | Inbox Average, %Q1 2024 | Inbox Average, %Q4 2023 |
| Amazon Workmail | 92,40 | 80,52 |
| GMX.com | 83,55 | 73,39 |
| Exchange (Office 365) | 77,43 | 65,74 |
| Gmail (non-interactive)* | 66,38 | 69,67 |
| G Suite (Google Workspace) | 63,85 | 66,38 |
| Zoho | 51,56 | 38,18 |
| Gmail (legacy)** | 51,05 | 57,82 |
| Outlook | 49,83 | 51,60 |
| Hotmail | 48,83 | 51,35 |
| Att.net | 46,45 | 48,41 |
| AOL | 43,56 | 50,14 |
| Yahoo | 43,08 | 49,59 |
| Total | 59,83 | 58,57 |
*Gmail (non-interactive) are the seed email addresses that we started using for tests in the Inbox Insight v2.0. These are relatively young mailboxes – 6 months old.
**Gmail (legacy) are the seed email addresses moved to the new seed lists from the old Inbox Insight tool. These are aged mailboxes that have been receiving email messages for years.
The reason we keep two categories of seed email addresses for Gmail is that Gmail is sensitive to user engagement and the value of sent emails more than other ISPs.
GlockApps Email Statistics: Average Inbox Placement Rates per ISP
From what we can see, the average Inbox placement rate in the beginning of 2024 increased with such mailbox providers as Amazon Workmail, GMX, and Office 365.
The average Inbox rates for Gmail, Outlook, AOL, and Yahoo in 2024 are slightly lower compared to 2023. This could be due to new email sender rules adopted by Gmail, Yahoo, and AOL in February 2024 and updated email filtering algorithms.
Email Deliverability Statistics: Spam Placement Rates per ISP: Q1 2024 vs Q4 2023
Below are the percentages of the average SPAM placement rates for the 4th quarter of 2023 and the 1st quarter of 2024.
| ISP | Spam Average, %Q1 2024 | Spam Average, %Q4 2023 |
| AOL | 44,76 | 30,14 |
| Yahoo | 44,63 | 29,13 |
| Hotmail | 39,34 | 26,85 |
| Outlook | 38,32 | 26,58 |
| Att.net | 38,00 | 27,06 |
| Gmail (legacy) | 30,95 | 19,70 |
| G Suite (Google Workspace) | 21,36 | 11,29 |
| Gmail (non-interactive) | 19,36 | 9,95 |
| Exchange (Office 365) | 10,88 | 13,12 |
| GMX.com | 4,62 | 9,68 |
| Zoho | 3,97 | 4,57 |
| Amazon Workmail | 0,60 | 0,89 |
| Total | 24,73 | 17,41 |
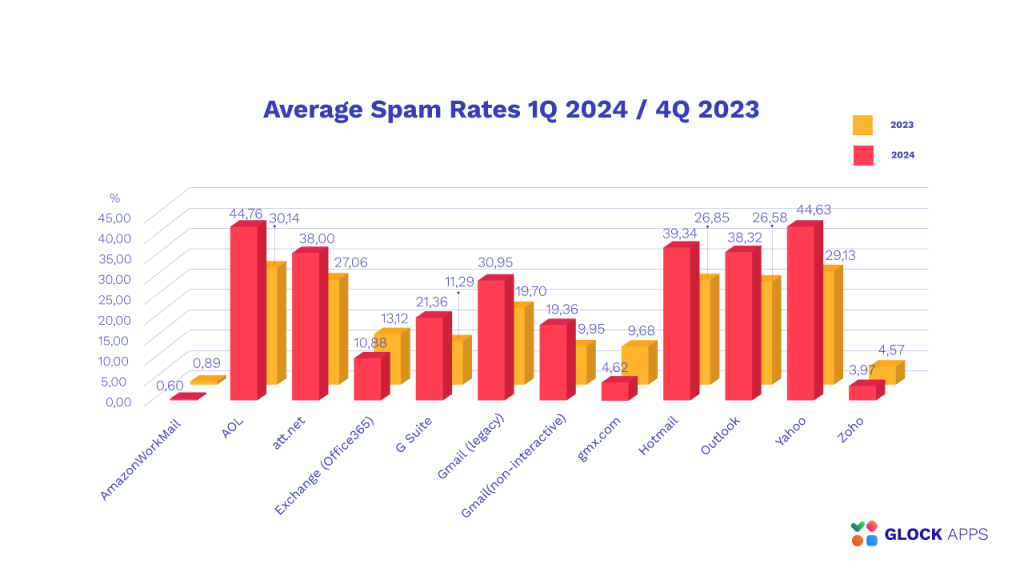
The Spam placement statistics show that the average percentage of emails filtered out to Spam in the 1st quarter 2024 increased with almost all popular ISPs with the exception for Office 365, GMX, Zoho, and Amazon Workmail.
Email Deliverability Statistics Q1 2024: Email Delivery Rates per Value
The statistics for the 4th quarter of 2023 revealed that the value of sent emails per month had a little impact on deliverability. Will it be the same in 2024? It’s time to look at the average email delivery rates in different sender groups depending on the value of emails sent per month.
Email Deliverability Rate Q1 2024: 1 – 10,000 Emails per Month
In this group of small senders, our analysis revealed these average delivery rates for the most popular ISPs:
| ISP | Inbox Average (%) | Spam Average (%) |
| Amazon Workmail | 87,44 | 0,25 |
| GMX.com | 81,68 | 4,26 |
| Zoho | 73,10 | 5,63 |
| Exchange (Office 365) | 64,22 | 17,33 |
| G Suite (Google Workspace) | 51,36 | 19,54 |
| Gmail (non-interactive) | 41,36 | 16,54 |
| Gmail (legacy) | 36,24 | 26,59 |
| Att.net | 36,00 | 53,31 |
| Outlook | 35,92 | 44,40 |
| Hotmail | 33,91 | 46,00 |
| AOL | 26,22 | 62,52 |
| Yahoo | 25,37 | 62,21 |
| Total | 49,40 | 29,88 |
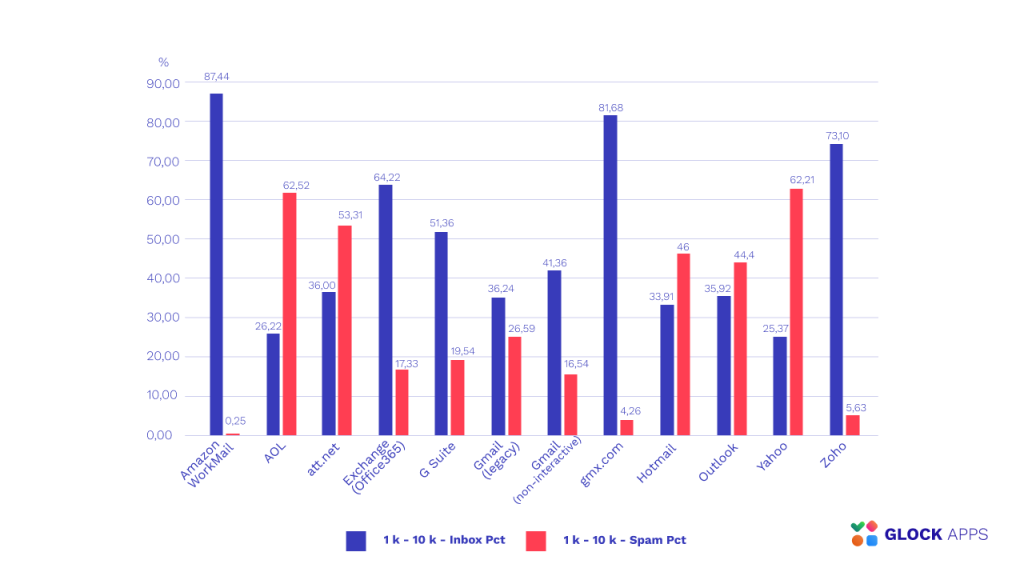
GlockApps Email Statistics: Average Email Delivery Rates per Value (1-10K)
Email Deliverability Rate Q1 2024: 10,001 – 50,000 Emails per Month
For the next group including the senders with 10,001 – 50,000 messages per month, we received the following email delivery data:
| ISP | Inbox Average (%) | Spam Average (%) |
| Amazon Workmail | 94,47 | 0,42 |
| Exchange (Office 365) | 88,39 | 5,30 |
| GMX.com | 86,76 | 6,14 |
| Zoho | 83,37 | 1,59 |
| G Suite (Google Workspace) | 73,77 | 19,83 |
| Gmail (non-interactive) | 69,28 | 24,57 |
| Gmail (legacy) | 52,73 | 38,63 |
| Outlook | 48,58 | 45,07 |
| Hotmail | 46,61 | 47,27 |
| Att.net | 36,56 | 53,18 |
| AOL | 31,74 | 58,72 |
| Yahoo | 30,45 | 58,88 |
| Total | 61,89 | 29,96 |
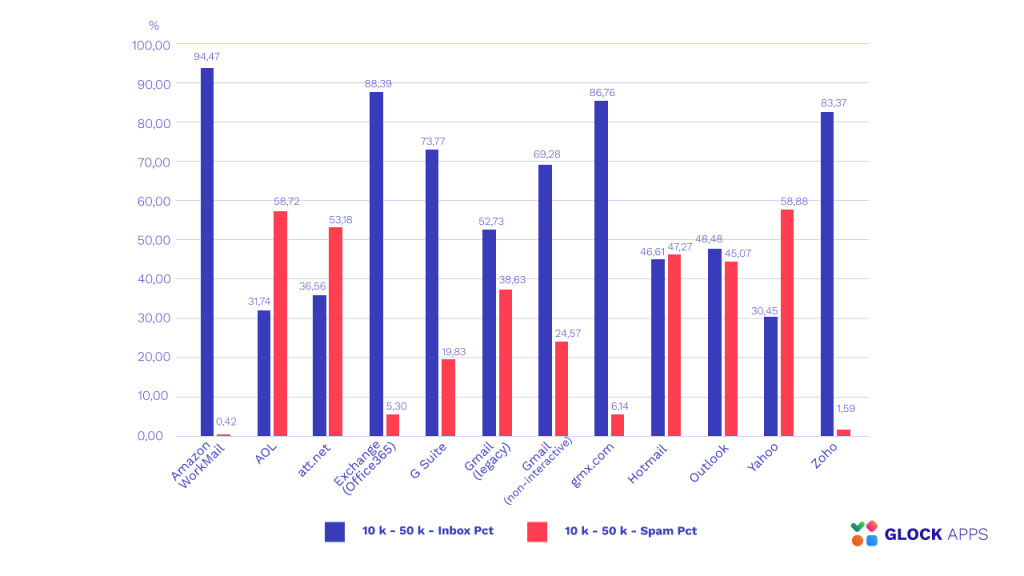
GlockApps Email Statistics: Average Email Deliverability Rates per Value (10-50K)
Email Deliverability Rate Q1 2024: 50,001 – 200,000 Emails per Month
Email senders with the monthly value of 50,001 – 200,000 messages demonstrated these average email delivery rates during the 1st quarter of 2024:
| ISP | Inbox Average (%) | Spam Average (%) |
| Amazon Workmail | 95,02 | 0,07 |
| GMX.com | 85,83 | 6,24 |
| Exchange (Office 365) | 83,85 | 5,81 |
| Gmail (non-interactive) | 76,36 | 16,12 |
| G Suite (Google Workspace) | 74,55 | 17,13 |
| Gmail (legacy) | 60,23 | 24,79 |
| Outlook | 56,07 | 36,64 |
| Hotmail | 55,92 | 36,64 |
| AOL | 53,73 | 38,07 |
| Yahoo | 52,62 | 37,04 |
| Att.net | 45,35 | 38,53 |
| Zoho | 40,55 | 0,94 |
| Total | 65,01 | 21,50 |
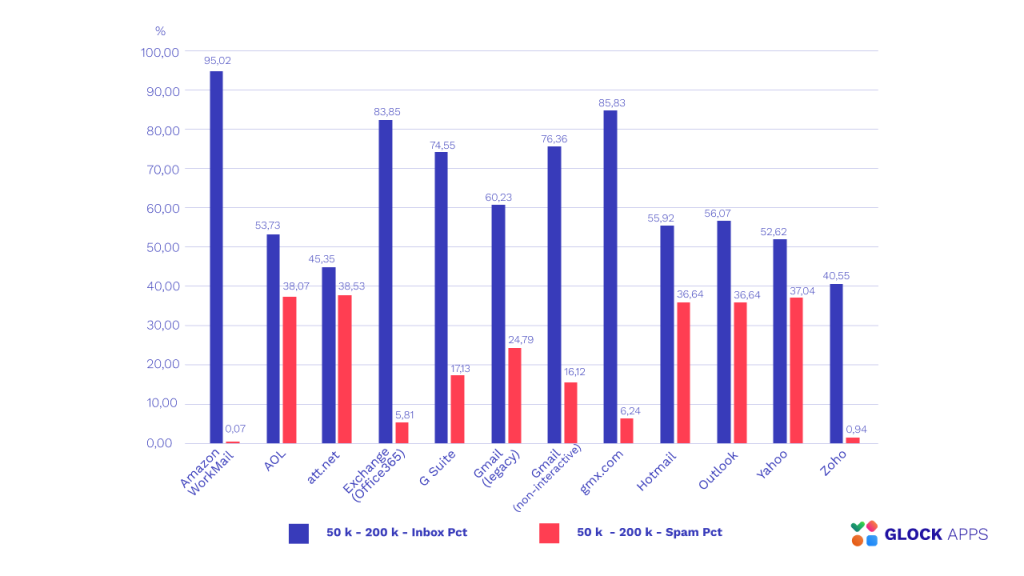
GlockApps Email Statistics: Average Email Delivery Rates per Value (50-200K)
Email Deliverability Rate Q1 2024: 200,001 – 1,000,000 Emails per Month
For large email value senders, our analysis of the data for the 1st quarter of 2024 revealed these email delivery rates:
| ISP | Inbox Average (%) | Spam Average (%) |
| Amazon Workmail | 97,87 | 0,06 |
| GMX.com | 95,36 | 1,33 |
| Exchange (Office 365) | 82,91 | 11,64 |
| Gmail (non-interactive) | 52,40 | 40,99 |
| G Suite (Google Workspace) | 46,18 | 44,92 |
| Gmail (legacy) | 26,81 | 41,19 |
| Att.net | 35,31 | 49,96 |
| Yahoo | 47,72 | 49,61 |
| AOL | 48,33 | 49,10 |
| Outlook | 52,38 | 38,76 |
| Hotmail | 52,52 | 39,97 |
| Zoho | 53,15 | 3,44 |
| Total | 49,77 | 30,91 |
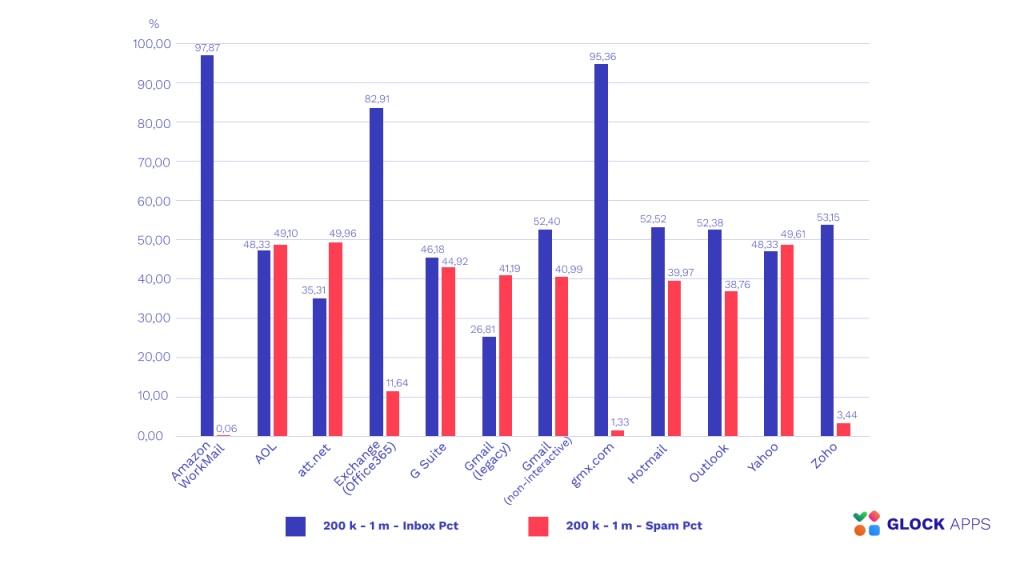
GlockApps Email Statistics: Average Email Delivery Rates per Value (200-1,000K)
Email Deliverability Rate Q1 2024: 1,000,000+ Emails per Month
According to our email testing statistics, senders distributing 1,000,000 and more messages per month got the average rates as follows:
| ISP | Inbox Average (%) | Spam Average (%) |
| GMX.com | 71,70 | 4,12 |
| Gmail (non-interactive) | 68,35 | 22,04 |
| Exchange (Office 365) | 66,24 | 17,94 |
| Att.net | 51,10 | 25,20 |
| Hotmail | 50,88 | 32,50 |
| Outlook | 50,66 | 33,55 |
| G Suite (Google Workspace) | 47,11 | 29,72 |
| Yahoo | 45,31 | 30,84 |
| AOL | 44,94 | 29,71 |
| Amazon Workmail | 44,32 | 1,06 |
| Gmail (legacy) | 42,34 | 36,03 |
| Zoho | 22,50 | 4,11 |
| Total | 49,98 | 20,60 |
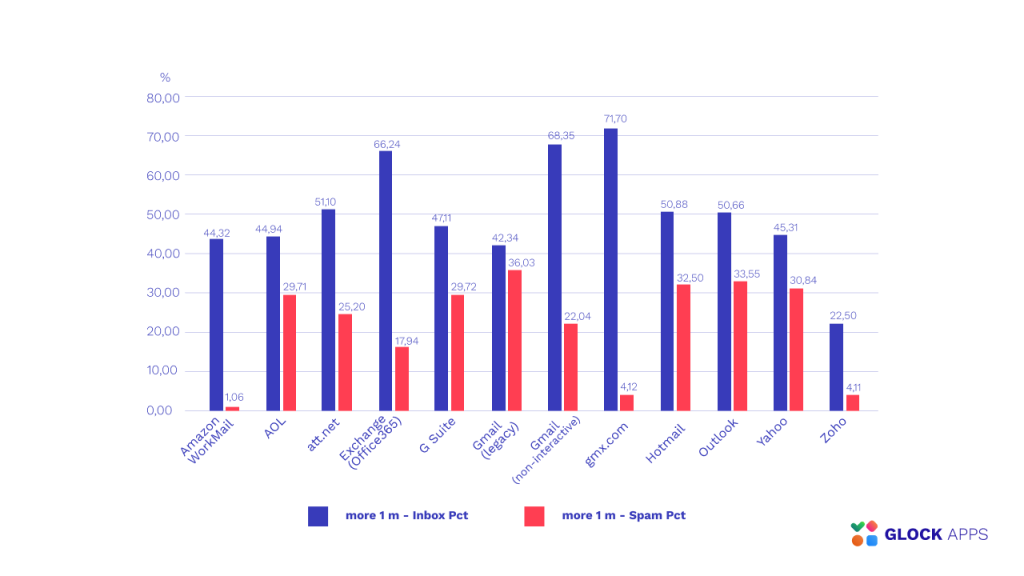
GlockApps Email Statistics: Average Email Delivery Rates per Value (1,000K +)
The Takeaway
In conclusion, we want to share the key takeaways we’ve come up with after analyzing the email delivery statistics for the 4th quarter of 2023 and the 1st quarter of 2024. Here is a quick summary of the most important changes in 2024:
– the average Inbox placement rate across all of the ISPs increased by 1,26%;
– the average Inbox placement rates for such ISPs as Amazon Workmail, GMX.com, Exchange (Office 365), and Zoho increased by 13-15%;
– the average Spam placement rate across all of the ISPs increased by 42%;
– the average Spam placement rates for AOL, Yahoo, Hotmail, and Outlook increased by 13-15%;
– the senders with 200,001 – 1,000,000 emails per month demonstrated the highest average Inbox placement – 68%;
– the senders with small values (1 – 10,000/month) and huge values (1,000,000+/month) had the worst Inbox placement rates – 49,40% and 49,98% respectively.
Although the data in this article can be a useful point of reference, it’s important to note that the deliverability rates vary depending on the email campaign type, email service provider, sender reputation, and ISPs filtering rules. Thus, email marketers should make email deliverability testing part of their regular preparations of the email campaign distribution.
Additionally, it is important to be aware of the latest updates to the best email practices published by different ISPs in order to make the changes in the email sending workflow if necessary and maximize the Inbox placement for your marketing or transactional communications.
Related Posts
For email marketers, achieving good email deliverability is essential. It indicates the percentage of emails that successfully landed in the Read more
Sender reputation is like your credit history, which is evaluated by email receiving servers when they accept your message for Read more

GlockApps provides a unique proxy testing solution designed to streamline and simplify your deliverability checking process and address any issues Read more

Briefly, a seed list definition is a series of email addresses that you send a letter to before sending it Read more