Email Deliverability Statistics 2023: What Percentage of Emails Went to Inbox?

Table of contents
Email Deliverability Statistics: Delivery per Top 5 ISPs
Let’s start with the average email delivery data for the major mailbox providers regardless of an email service provider used, the volume of emails sent, or the type of email messages (subscription or cold).
Our calculation gives these email delivery statistics when the messages are sent to the five major ISPs:
AOL average delivery rates:
- Inbox: 38.3%;
- Spam: 34.2%;
- Undelivered: 27.5%.
Yahoo average delivery rates:
- Inbox: 38.6%;
- Spam: 34.8%;
- Undelivered: 26.6%.
Gmail average delivery rates:
- Inbox: 70.7%;
- Spam: 14.8%;
- Undelivered: 14.5%.
Outlook average delivery rates:
- Inbox: 39.9%;
- Spam: 34.7%;
- Undelivered: 25.3%.
Hotmail average delivery rates:
- Inbox: 40.6%;
- Spam: 33.6%;
- Undelivered: 25.8%.
So far, Gmail showed the best deliverability in the Inbox and the lowest percentage of undelivered – mostly blocked – messages. But the numbers may change as the Gmail new email sender standards became effective starting from February 1st, 2024.
Email Deliverability Statistics: Delivery per Email Service Providers
We were often asked what the best email service provider (ESP) in terms of deliverability was. That’s a good question indeed because the reputation of the sending IP address is counted for email placement.
Each ESP is using its own set of IP addresses, which are shared between numerous senders. The reputation of these IPs is built based on the sending habits of all the senders.
Thus, the way an ESP manages the clients’ mailing lists (unsubscribes, complaints, and bounce emails) and controls what types of messages and to whom the clients send has an impact on the reputation of the IPs.
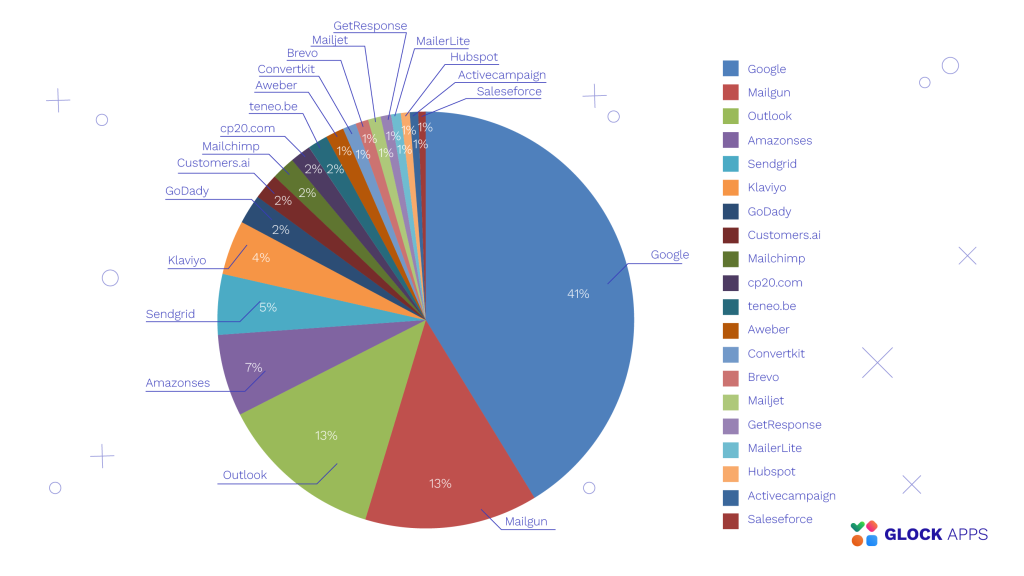
Before we dive into email deliverability statistics per ESP, we want to share the data about the most popular email service providers used by GlockApps customers.
The percentage of GlockApps customers using different email service providers is as follows:
- Google – 41%
- Mailgun – 13%, Outlook – 13%
- Amazon SES – 7%
- SendGrid – 5%
- Klaviyo – 4%
- GoDaddy – 2%, Customers.ai – 2%, MailChimp – 2%, Cp20.com – 2%, teneo.be – 2%
- AWeber, – 1%, ConvertKit – 1%, Brevo – 1%, Mailjet – 1%, GetResponse – 1%, MailerLite – 1%, Hubspot – 1%, ActiveCampiagn – 1%, Salesforce – 1%.
The percentage of customers using other email service providers such as Sendinblue, Mimecast, Keap, and other makes less than 1%.
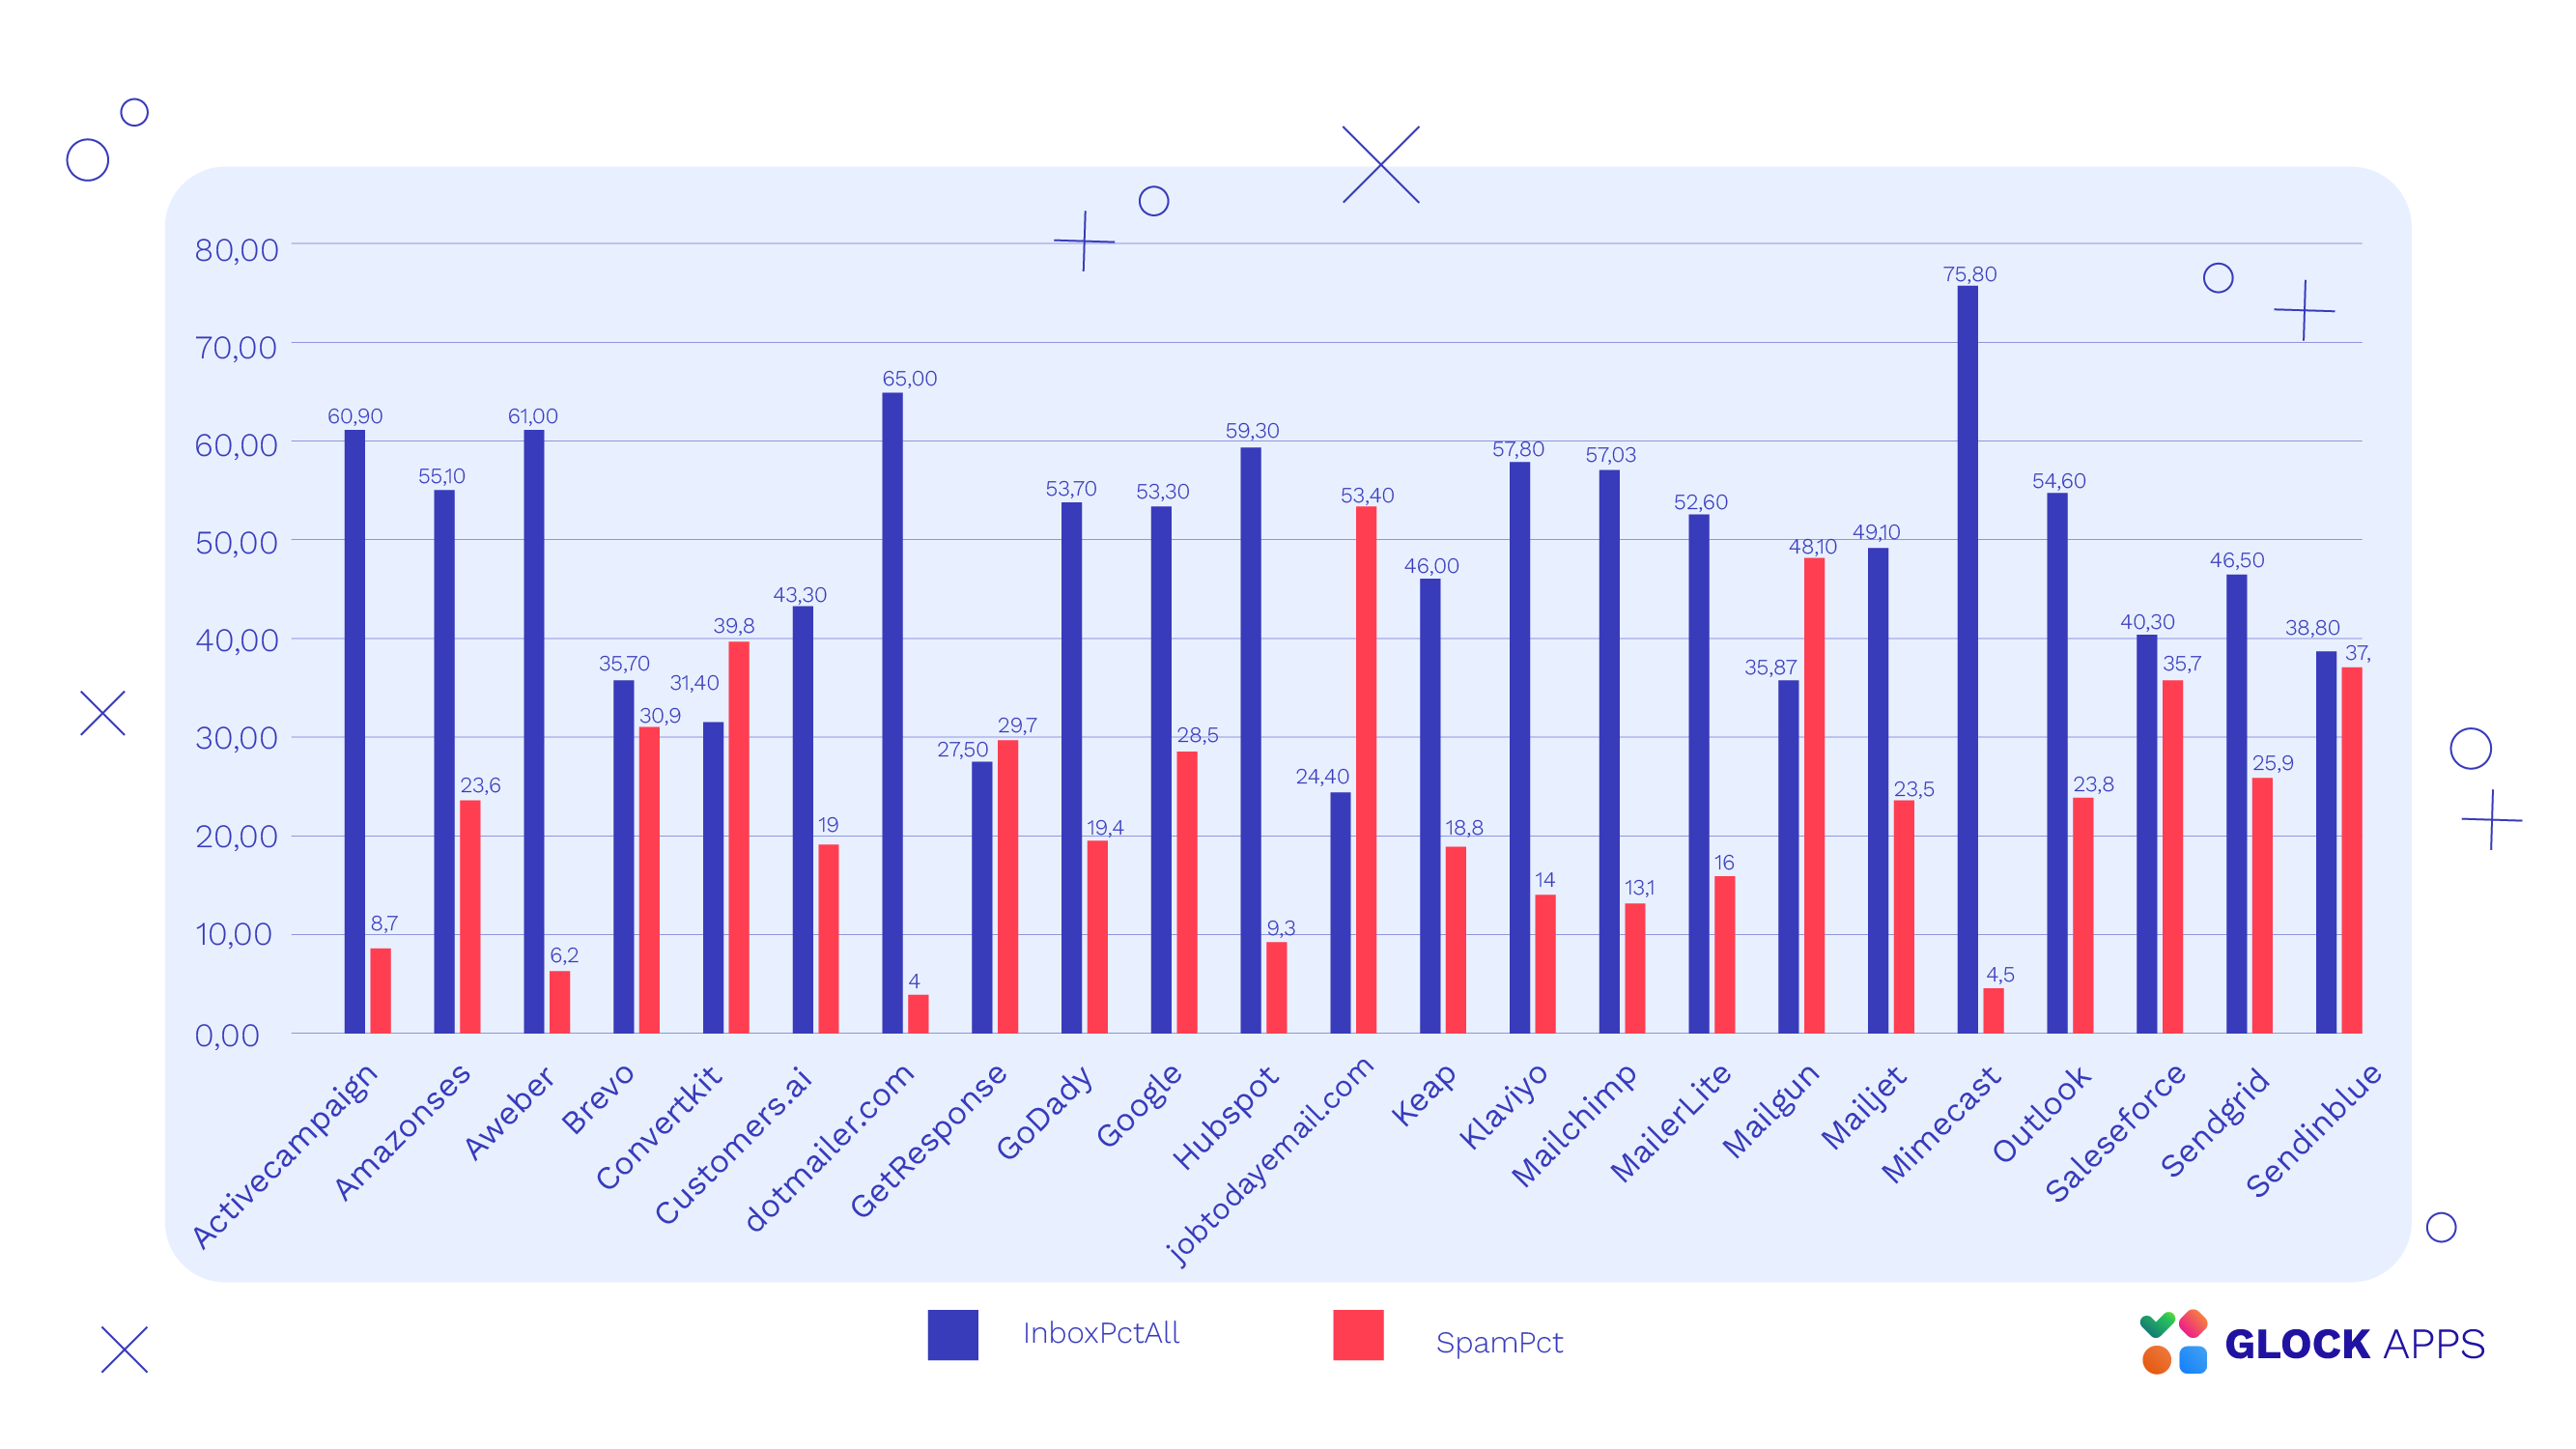
Our analysis of the emailing statistics for the fourth quarter of 2023 shows that the highest deliverability – in average 50+% emails went to Inbox – was demonstrated by these ESPs:
| ESP | Inbox Average (%) | Spam Average (%) |
| Mimecast | 75,8 | 4,5 |
| DotMailer | 65,0 | 4,0 |
| AWeber | 61,0 | 6,2 |
| ActiveCampaign | 60,9 | 8,7 |
| Hubspot | 59,3 | 9,3 |
| Klaviyo | 57,8 | 14,0 |
| MailChimp | 57,03 | 13,1 |
| Amazon SES | 55,1 | 23,6 |
| Outlook | 54,6 | 23,8 |
| GoDaddy | 53,7 | 19,4 |
| 53,3 | 28,5 | |
| MailerLite | 52,6 | 16,0 |
Email Deliverability Statistics: Average Deliverability per Volume
Email experts agree that consistency in email sending is important for good deliverability. In email marketing, consistency means sending an approximately same volume of messages at a regular interval. Thus, if you plan email campaigns about your blog or product update, you’ll want to schedule them for a particular day of week or month. Consistent senders are treated as trusted more often than inconsistent marketers.
Now, what about the volume? Does the volume of emails sent per month affect delivery?
We divided all GlockApps users into five groups based on the number of email messages sent per month. Below we’re sharing the average emailing statistics for each group.
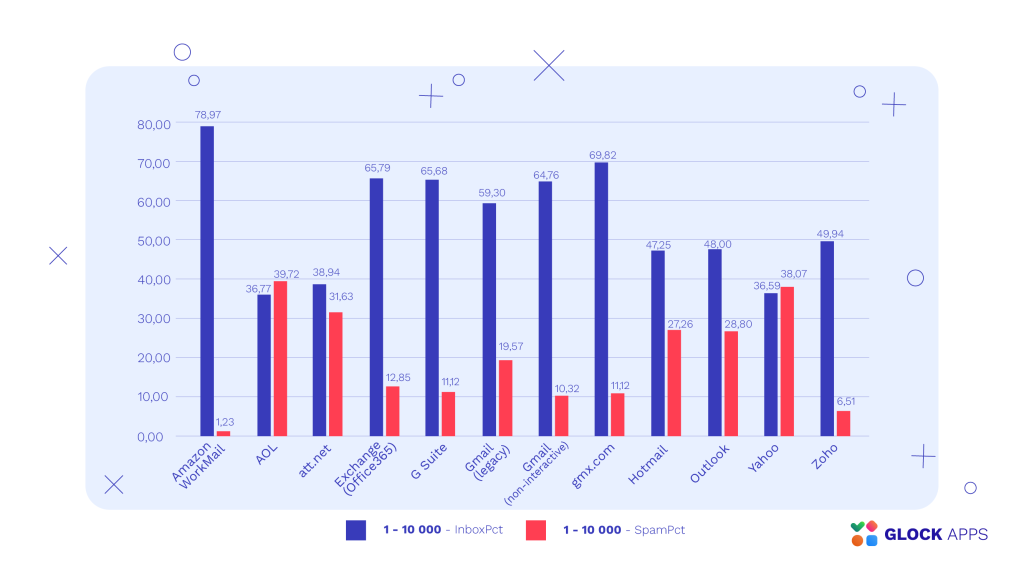
Email Deliverability Rate: 1 – 10,000 Emails per Month
From what we’ve got, the highest average Inbox placement rate in this sender group was demonstrated for these ISPs:
| ISP | Inbox Average (%) | Spam Average (%) |
| Amazon Workmail | 78,97 | 1,23 |
| GMX.com | 69,82 | 11,12 |
| Exchange (Office 365) | 65,79 | 12,85 |
| G Suite (Google Workspace) | 65,68 | 11,12 |
| Gmail (non-interactive)* | 64,76 | 10,32 |
| Gmail (legacy)** | 59,30 | 19,57 |
*Gmail (non-interactive) are the seed email addresses that we started using for tests in the Inbox Insight v2.0. These are relatively young mailboxes – 3 months old.
**Gmail (legacy) are the seed email addresses moved to the new seed lists from the old Inbox Insight tool. These are aged and well warmed up mailboxes that have been receiving email messages for years.
The reason we keep two categories of seed email addresses for Gmail is that Gmail is sensitive to user engagement and the volume of sent emails more than other ISPs.
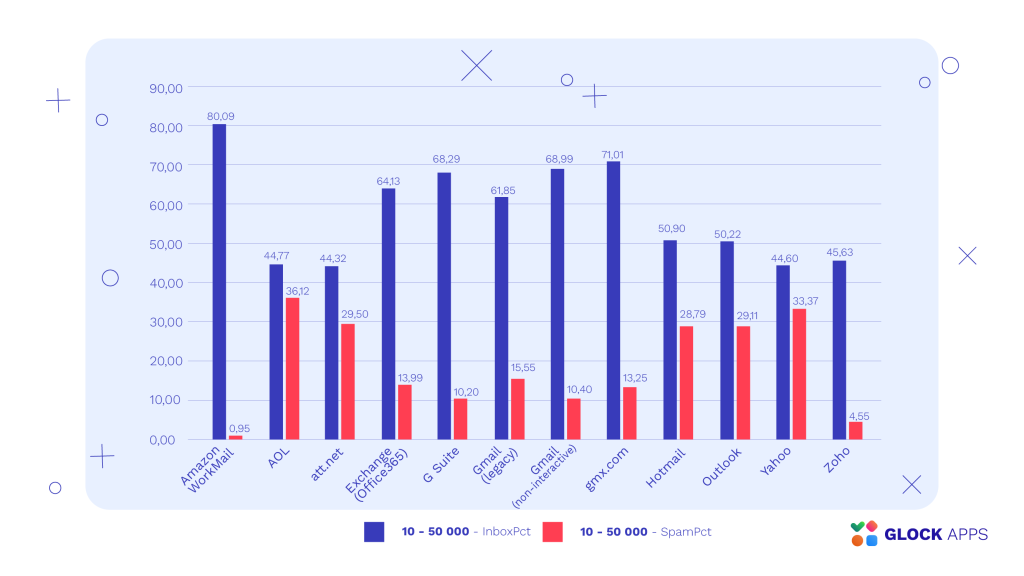
Email Deliverability Rate: 10,001 – 50,000 Emails per Month
The next group is the senders with 10,001 – 50,000 messages per month. In this group, the ISP that delivered more than 50% emails in the Inbox are:
| ISP | Inbox Average (%) | Spam Average (%) |
| Amazon Workmail | 80,09 | 0,95 |
| GMX.com | 71,01 | 13,25 |
| Gmail (non-interactive) | 68,99 | 10,40 |
| G Suite (Google Workspace) | 68,29 | 10,20 |
| Exchange (Office 365) | 64,13 | 13,99 |
| Gmail (legacy) | 61,85 | 15,55 |
| Hotmail | 50,90 | 28,79 |
| Outlook | 50,22 | 29,11 |
The ISP that placed the highest number of emails in Spam are AOL (36,12%) and Yahoo (33,37%).
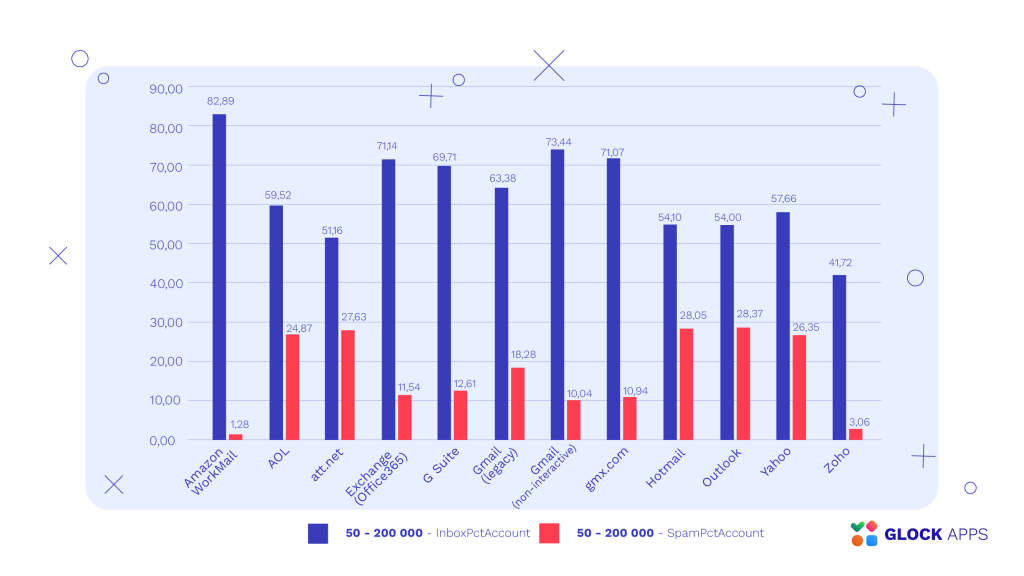
Email Deliverability Rate: 50,001 – 200,000 Emails per Month
Senders in this group had their email communications delivered in the Inbox most often with the following ISPs:
| ISP | Inbox Average (%) | Spam Average (%) |
| Amazon Workmail | 82,89 | 1,28 |
| Gmail (non-interactive) | 73,44 | 10,04 |
| Exchange (Office 365) | 71,14 | 11,54 |
| GMX.com | 71,07 | 10,94 |
| G Suite (Google Workspace) | 69,71 | 12,61 |
| Gmail (legacy) | 63,38 | 18,28 |
| AOL | 59,52 | 24,87 |
| Yahoo | 57,66 | 26,35 |
| Hotmail* | 54,10 | 28,05 |
| Outlook* | 54,00 | 28,37 |
| Att.net* | 51,16 | 27,63 |
*The top three providers that filtered the highest number of emails as spam.
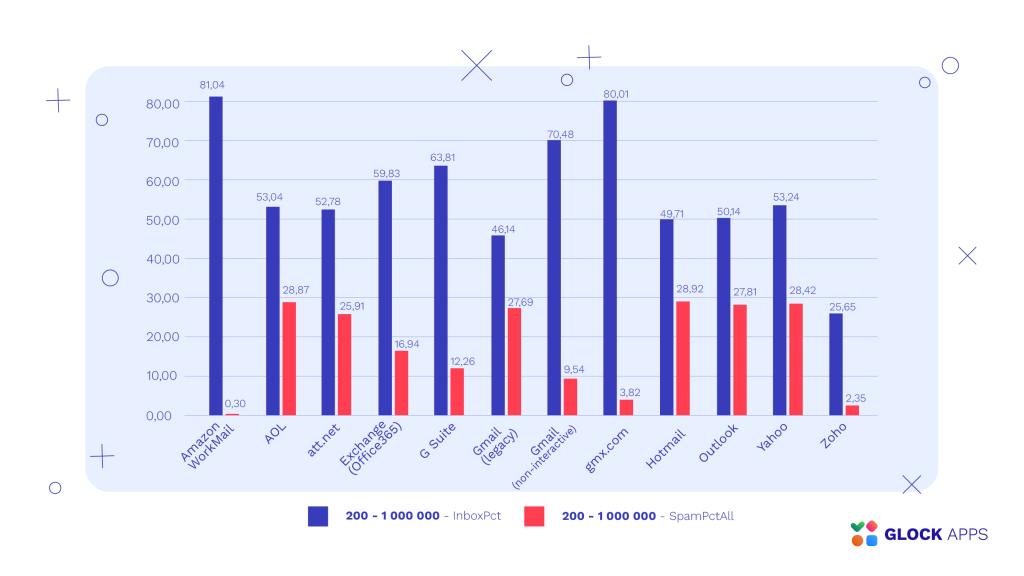
Email Deliverability Rate: 200,001 – 1,000,000 Emails per Month
For large email volume senders, the average Inbox placement rate higher than 50% was demonstrated by these ISPs:
| ISP | Inbox Average (%) | Spam Average (%) |
| Amazon Workmail | 81,04 | 0,30 |
| GMX.com | 80,01 | 3,82 |
| Gmail (non-interactive) | 70,48 | 9,54 |
| G Suite (Google Workspace) | 63,81 | 12,26 |
| Exchange (Office 365) | 59,83 | 16,94 |
| Yahoo | 53,24 | 28,42 |
| AOL | 53,04 | 28,87 |
| Att.net | 52,78 | 25,91 |
| Outlook | 50,14 | 27,81 |
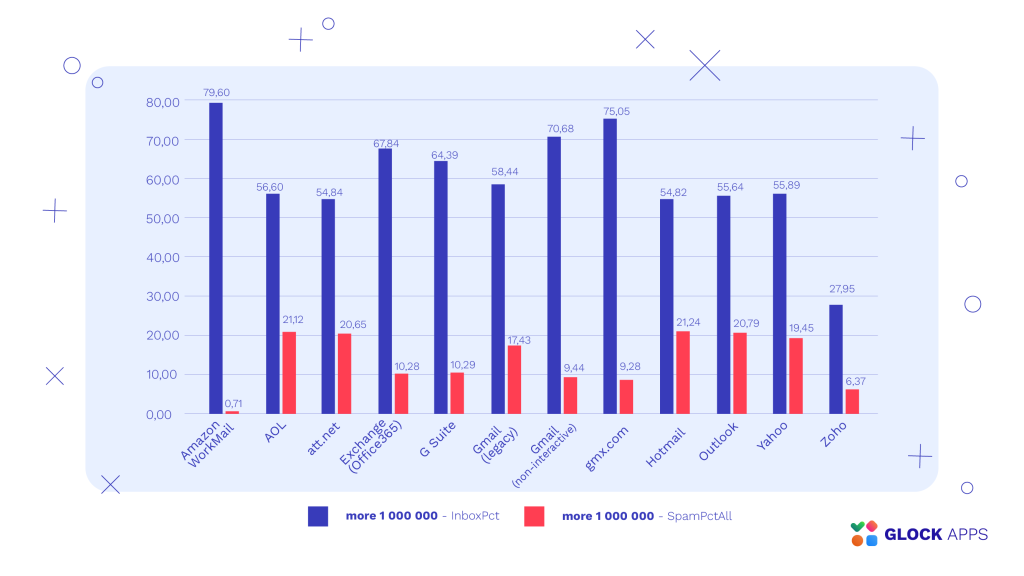
Email Deliverability Rate: 1,000,000+ Emails per Month
Very large email volume senders emailing starting at 1,000,000 messages per month got the average rates as follows:
| ISP | Inbox Average (%) | Spam Average (%) |
| Amazon Workmail | 79,60 | 0,71 |
| GMX.com | 75,05 | 9,28 |
| Gmail (non-interactive) | 70,68 | 9,44 |
| Exchange (Office 365) | 67,84 | 10,28 |
| G Suite (Google Workspace) | 64,39 | 10,29 |
| Gmail (legacy) | 58,44 | 17,43 |
| AOL | 56,60 | 21,12 |
| Yahoo | 55,89 | 19,45 |
| Outlook | 55,64 | 20,79 |
| Att.net | 54,84 | 20,65 |
| Hotmail | 54,82 | 21,24 |
| Zoho | 27,95 | 6,37 |
The Takeaway
What we’ve learned during the analysis of our email deliverability statistics for the fourth quarter of 2023 is that the volume of emails sent has a little impact on deliverability. Whether you are a small or large email sender, the key is consistency and adherence to email sender guidelines advertised by each ISP.
Although the data in this article can be a useful point of reference, it’s important to check back frequently because email deliverability is a constantly changing field with varying numbers every year.
If you are involved in email marketing, it is essential to be educated about deliverability and understand the various factors that impact email deliverability rates. It is important to be aware of the recommended email practices published by different ISPs to get the highest possible deliverability rates and use good deliverability monitoring tools to perform your deliverability check on a regular basis.
Related Posts

It’s no secret that email authentication isn’t optional anymore. With mailbox providers like Google and Yahoo tightening sender requirements, companies Read more

Deliverability rules from providers like Google and Microsoft have made mailbox management a critical part of any outreach strategy. If Read more

If your email campaigns suddenly start underperforming, there’s a strong chance spam traps are involved. From my experience in email Read more

For 59% of marketers, email is the top channel for revenue generation. This year, the stakes are getting even higher Read more