New Report: Email Deliverability Statistics Q2 2024 – Analysis, Changes, and General Trends [+ Free PDF Inside]

Estimated reading time: 13 minutes
A lot of different factors determine whether or not an email will reach the targeted recipient and where it will be put: Inbox or Junk folder. These factors include the message copy, sender’s domain reputation, sender’s IP score, prior user interaction, and sending infrastructure.
Additionally, each ISP uses a set of its rules to identify email spam signals, which make it place the message to the Spam folder. Needles to say, the recipients may configure custom filtering settings in their email clients to keep unwanted messages out of their inboxes.
All of this gives more obstacles for senders trying to deliver their email communications to the recipients and demands a more thoughtful approach to email marketing, which includes email deliverability testing.
Email testing helps create email campaigns compliant with always changing rules of the email deliverability game. Decreased open rates, low response rates, no replies from the recipients – these signals suggest testing your Inbox placement.
Lots of senders realize the necessity of deliverability testing and monitoring running hundreds of tests at GlockApps daily. Thus, our series of email deliverability statistics reports continues. We’ve already shared email deliverability statistics for 2023 and the quarter I of 2024 and now we came up with the statistics for the quarter II of 2024.
Let’s examine the average email deliverability rates for the quarter II of 2024 together. As always, the data is calculated based on email tests made by the GlockApps users.
Note: the messages that were not counted as received in the Inbox or Spam folder are to be considered undelivered. We omitted the statistics on the undelivered emails in our report.
Email Deliverability Statistics: Email Delivery Rates per Senders (ESPs)
What is the best email service provider? Our clients often ask this question on demo calls and live chat. It sounds simple but the answer is complicated – it depends on the type of email communications, recipients’ base, email frequency, domain reputation, etc.
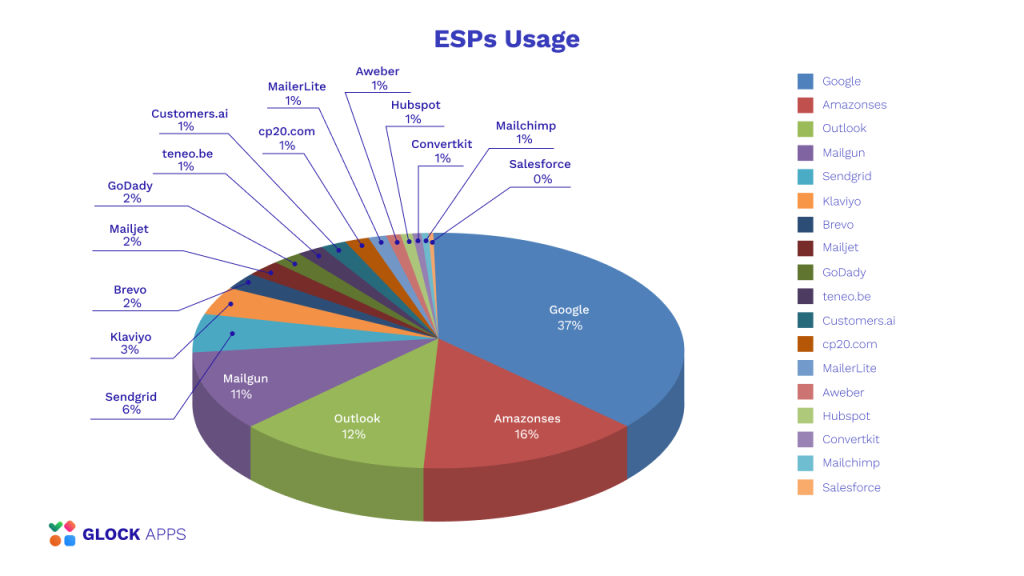
However, as our previous reports demonstrated, Google was the most popular email service provider among our clients. Thus, in 2023, 41% of GlockApps users were using Google to send email campaigns; in the 1st quarter of 2024, Google was still on the top with 37%.
The analysis of the tests made during the 2nd quarter of 2024 returned these numbers:
- Google – 37%
- Amazon SES – 16%
- Outlook -12%
- Mailgun – 11%
- SendGrid – 6%
Thus, Google still takes the first place followed by Amazon SES, Outlook, Mailgun, and SendGrid.
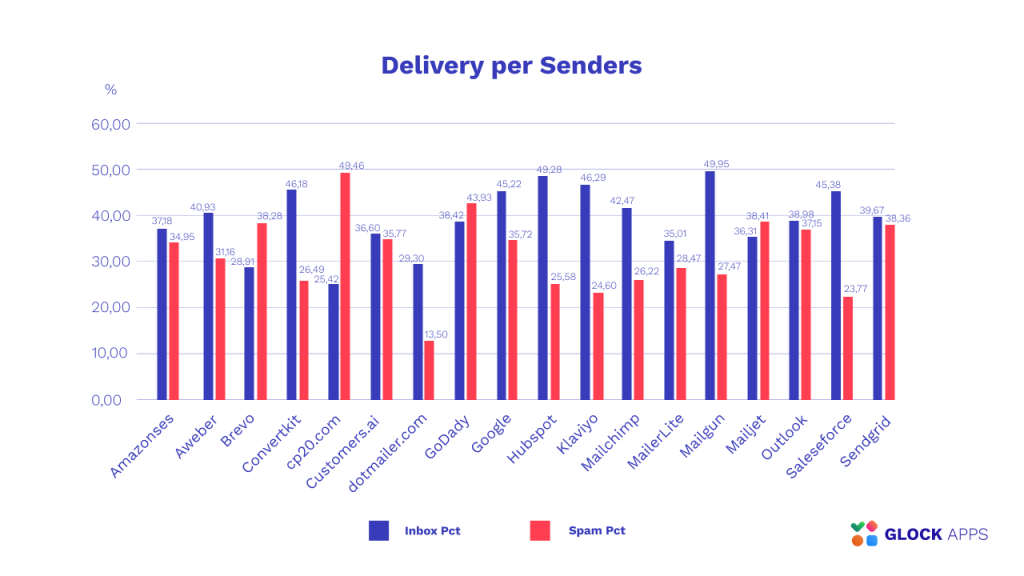
What are the senders with the highest deliverability? To find it out, look at the statistics on the average delivery rates for different ESPs for the 2nd quarter of 2024.
According to GlockApps email tests, the top ten ESPs with the highest Inbox placement rates are:
| ESP | Inbox Average (%) | Spam Average (%) |
| Mailgun | 49,95 | 27,47 |
| Hubspot | 49,28 | 25,58 |
| ConvertKit | 46,18 | 26,49 |
| Salesforce | 45,38 | 23,77 |
| 45,22 | 35,72 | |
| MailChimp | 42,47 | 26,22 |
| Aweber | 40,93 | 31,16 |
| SendGrid | 39,67 | 38,36 |
| Outlook | 38,98 | 37,15 |
| GoDaddy | 38,42 | 43,93 |
Email Deliverability Statistics: Email Delivery Rates per Mailbox Providers (ISPs)
Next, we share the data on the average email delivery rates for the most popular mailbox providers (ISPs). It is to note that this data doesn’t take an email service provider used, the volume of emails sent, or the type of email messages (marketing, promotion, subscription, or cold outreach) into account.
We created comparison tables for you to quickly show the changes in the average delivery rates by quarters.
Email Deliverability Statistics 2024: Inbox Placement Rates per ISP – Q2 vs Q1
Below is the comparison table showing the average INBOX placement rates for the most popular ISPs for the quarter II and the quarter I of 2024.
| ISP | Inbox Average, %Q2 2024 | Inbox Average, %Q1 2024 |
| Amazon Workmail | 80,54 | 83,83 |
| GMX.com | 72,48 | 84,27 |
| Exchange (Office 365) | 70,21 | 77,12 |
| Gmail (non-interactive)* | 54,44 | 61,55 |
| G Suite (Google Workspace) | 51,14 | 58,59 |
| Zoho | 46,73 | 54,53 |
| Att.net | 42,73 | 40,86 |
| Gmail (legacy)** | 40,06 | 43,67 |
| Hotmail | 36,77 | 47,97 |
| Yahoo | 35,16 | 40,29 |
| AOL | 34,91 | 40,99 |
| Outlook | 34,11 | 48,72 |
| Total | 49,94 | 56,87 |
*Gmail (non-interactive) are the seed email addresses that we started using for tests in the Inbox Insight v2.0. These are relatively young mailboxes – 9 months old.
**Gmail (legacy) are the seed email addresses moved to the new seed lists from the old Inbox Insight tool. These are aged mailboxes that have been receiving email messages for years.
The reason we keep two categories of seed email addresses for Gmail is that Gmail is sensitive to user engagement and the volume of sent emails more than other ISPs.
It is regrettable but the average Inbox placement rate in the quarter II 2024 was worse than it was in the quarter I. Looking at the numbers for each ISP in particular, it is possible to observe a trend for a decreased Inbox placement ratio across all of the monitored ISPs.
It is disappointing to see Outlook sending 14% less emails to Inbox and Gmail and Google Workspace delivering 7% less messages to the Inbox. The good exception is the att.net provider, which increased the Inbox ratio by 2% compared to the previous period.
Email Deliverability Statistics 2024: Spam Placement Rates per ISP – Q2 vs Q1
Below are the statistics for the average SPAM placement rates for the quarter II compared to the quarter I of 2024.
| ISP | Spam Average, %Q2 2024 | Spam Average, %Q1 2024 |
| Yahoo | 42,35 | 47,72 |
| AOL | 42,07 | 47,62 |
| Outlook | 38,75 | 39,58 |
| Hotmail | 37,28 | 40,48 |
| G Suite (Google Workspace) | 36,10 | 26,23 |
| Gmail (legacy) | 35,05 | 33,45 |
| Gmail (non-interactive) | 31,25 | 24,05 |
| Att.net | 30,01 | 44,04 |
| Exchange (Office 365) | 7,71 | 11,60 |
| Zoho | 5,40 | 3,14 |
| GMX.com | 4,80 | 4,42 |
| Amazon Workmail | 0,57 | 0,37 |
| Total | 25,95 | 26,90 |
The analysis of the average Spam placement ratios across the monitored ISPs revealed a considerable increase of emails filtered out to Spam by Gmail (mostly for non-interactive addresses) and Google Workspace. One of the possible reasons for this drop is that not all the senders have started following Google’s new email sender requirements yet. The good news is that the Att.net provider filtered out as spam 14% less messages than in the quarter I.
Email Deliverability Statistics Q2 2024: Email Delivery Rates per Volume
Does email placement depend on the volume of emails sent from a domain monthly? Which ISPs love small senders? Can you still deliver to Inbox if you send millions of emails every month? The statistics on the average email delivery rates in different sender groups depending on the volume of emails sent per month helps answer these questions.
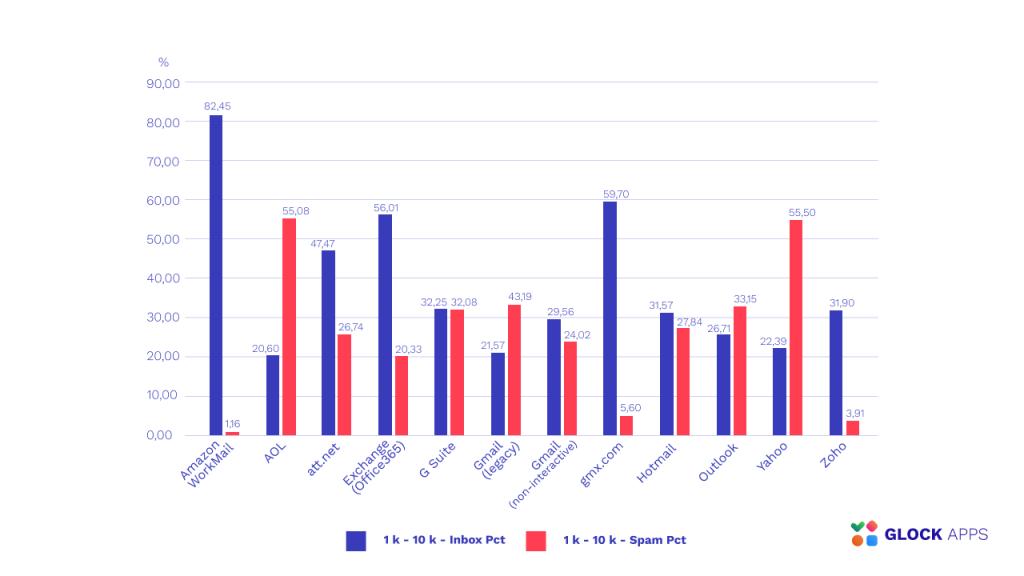
Email Deliverability Rate: 1 – 10,000 Emails per Month
For small senders, our analysis revealed these average delivery rates for the most popular ISPs:
| ISP | Inbox Average (%) | Spam Average (%) |
| Amazon Workmail | 82,45 | 1,16 |
| GMX.com | 59,70 | 5,60 |
| Exchange (Office 365) | 56,01 | 20,33 |
| Att.net | 47,47 | 26,74 |
| G Suite (Google Workspace) | 32,25 | 32,08 |
| Zoho | 31,90 | 3,91 |
| Hotmail | 31,57 | 27,34 |
| Gmail (non-interactive) | 29,56 | 24,02 |
| Outlook | 26,71 | 33,15 |
| Yahoo | 22,39 | 55,50 |
| Gmail (legacy) | 21,57 | 43,19 |
| AOL | 20,60 | 55,08 |
| Total | 38,52 | 27,38 |
Investigating this data, we can see that Amazon Workmail, GMX.com, and Office 365 welcome small volume senders delivering the greatest part of their emails to the Inbox. From the opposite side stand AOL and Yahoo, which are filtering more than half messages of low volume senders to Spam.
Email Deliverability Rate (Q2 2024): 10,001 – 50,000 Emails per Month
The analysis of the data for the quarter II of 2024 for the group including the senders with 10,001 – 50,000 messages per month showed these results:
| ISP | Inbox Average (%) | Spam Average (%) |
| Amazon Workmail | 85,52 | 1,12 |
| Exchange (Office 365) | 83,56 | 4,06 |
| GMX.com | 79,76 | 6,06 |
| Zoho | 66,61 | 5,11 |
| G Suite (Google Workspace) | 62,19 | 25,61 |
| Gmail (non-interactive) | 60,69 | 27,36 |
| Gmail (legacy) | 47,70 | 36,51 |
| Att.net | 44,17 | 39,24 |
| AOL | 38,97 | 44,08 |
| Yahoo | 38,93 | 44,62 |
| Hotmail | 38,68 | 49,60 |
| Outlook | 38,26 | 47,34 |
| Total | 57,01 | 27,56 |
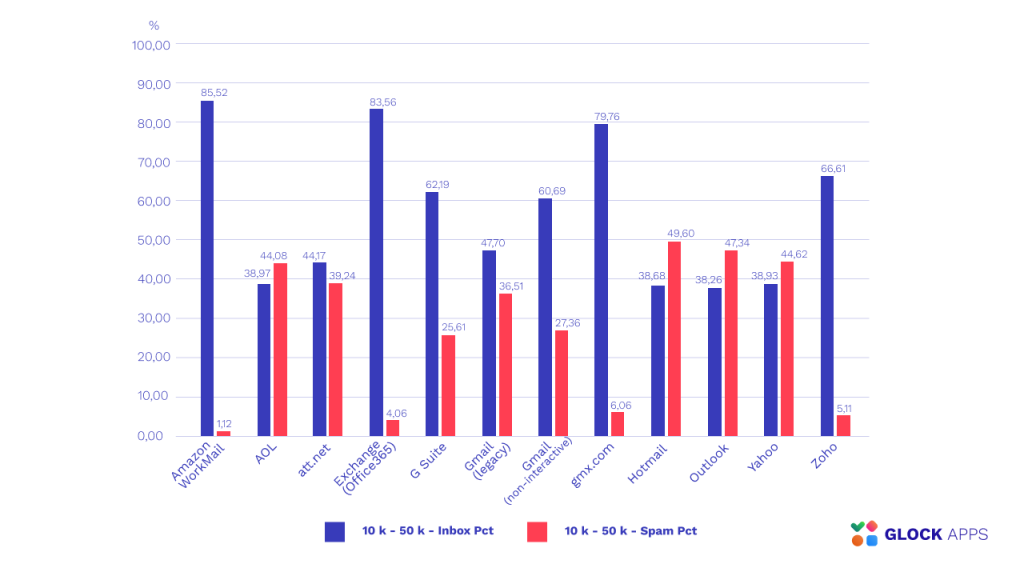
As we can see, AOL, Yahoo, Hotmail and Outlook are filtering almost half of sent emails to Spam while Amazon Workmail delivers 85% of emails to the recipients’ Inboxes. There is good news for marketers sending to the Office 365 mailboxes – with the 83% average Inbox placement rate, there is a high probability that their messages will land in the Inbox.
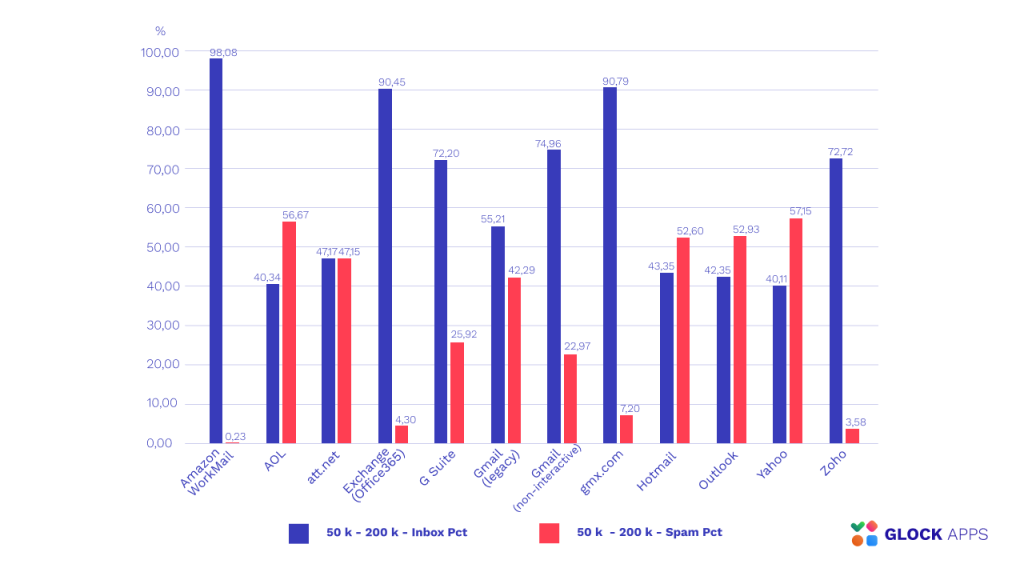
Email Deliverability Rate (Q2 2024): 50,001 – 200,000 Emails per Month
For email senders with the monthly volume of 50,001 – 200,000 messages we received these average email delivery rates for the quarter II of 2024:
| ISP | Inbox Average (%) | Spam Average (%) |
| Amazon Workmail | 98,08 | 0,23 |
| GMX.com | 90,79 | 7,20 |
| Exchange (Office 365) | 90,45 | 4,30 |
| Gmail (non-interactive) | 74,96 | 22,97 |
| Zoho | 72,72 | 3,58 |
| G Suite (Google Workspace) | 72,20 | 25,92 |
| Gmail (legacy) | 55,21 | 42,29 |
| Att.net | 47,11 | 47,15 |
| Hotmail | 43,35 | 52,60 |
| Outlook | 42,35 | 52,93 |
| AOL | 40,34 | 56,67 |
| Yahoo | 40,11 | 57,15 |
| Total | 63,97 | 31,08 |
The data demonstrates that the top three ISPs that place 90+% of messages sent by the marketers with the 50,001 – 200,000 monthly volume to the Inbox are Amazon Workmail, GMX.com, and Office 365.
The providers with the worst deliverability for this group of senders are AOL and Yahoo with the 40% average Inbox placements ratios.
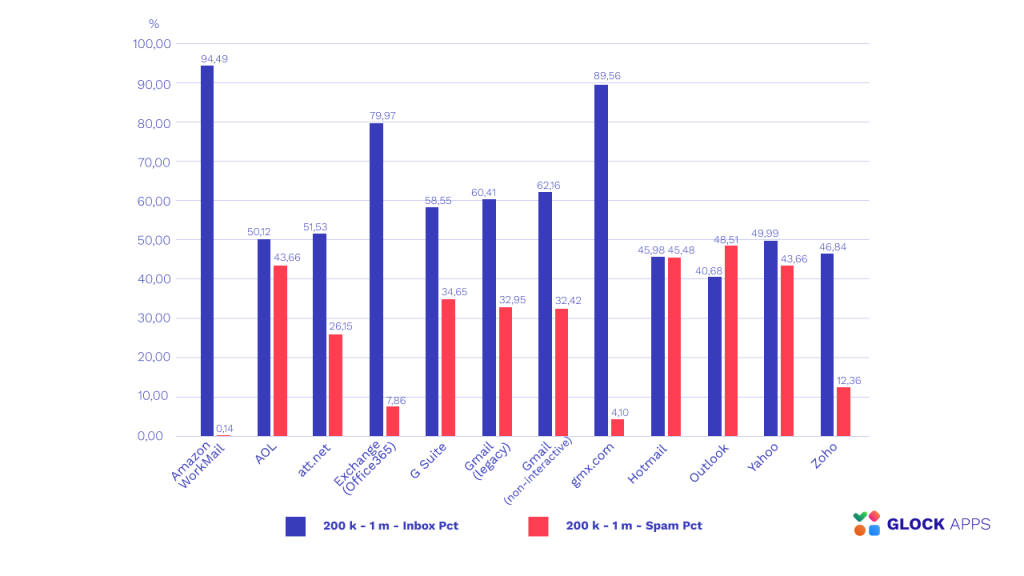
Email Deliverability Rate (Q2 2024): 200,001 – 1,000,000 Emails per Month
For this segment of email senders, our analysis of the deliverability tests made during the quarter II of 2024 revealed these average Inbox and Spam placement rates:
| ISP | Inbox Average (%) | Spam Average (%) |
| Amazon Workmail | 94,49 | 0,14 |
| GMX.com | 89,56 | 4,10 |
| Exchange (Office 365) | 79,97 | 7,86 |
| Gmail (non-interactive) | 62,16 | 32,42 |
| Gmail (legacy) | 60,41 | 32,95 |
| G Suite (Google Workspace) | 58,55 | 34,65 |
| Att.net | 51,53 | 26,15 |
| AOL | 50,12 | 43,66 |
| Yahoo | 49,99 | 43,66 |
| Zoho | 46,84 | 12,36 |
| Hotmail | 45,98 | 45,48 |
| Outlook | 40,68 | 48,51 |
| Total | 60,86 | 27,66 |
Again, the top three ISPs with the highest Inbox placement rates are Amazon Workmail, GMX.com, and Office 365.
The worst Inbox placement rate is observed for Hotmail and Outlook, which delivered only 45% and 40% emails to the Inbox respectively.
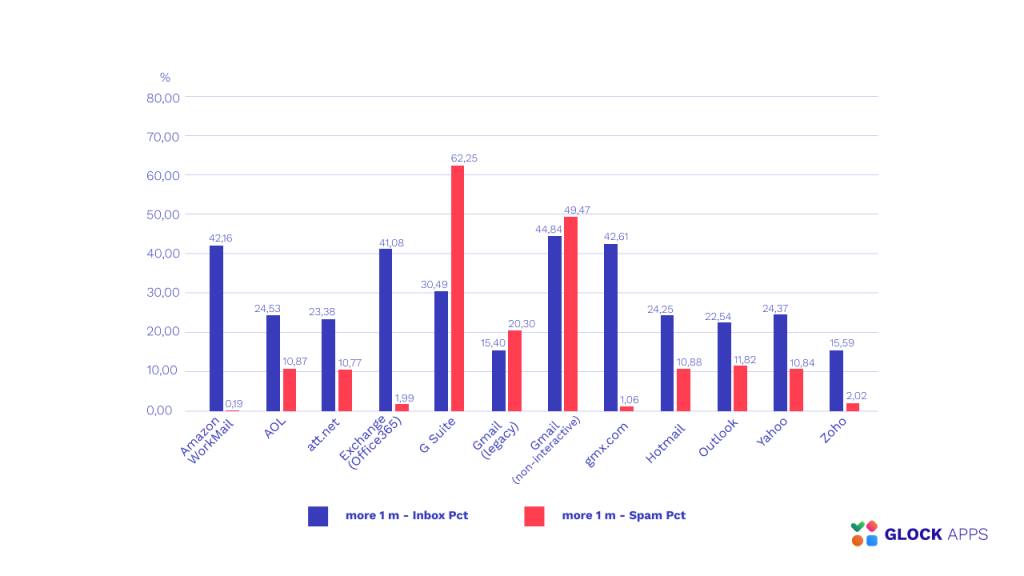
Email Deliverability Rate (Q2 2024): 1,000,000+ Emails per Month
According to our email testing statistics, senders with 1,000,000+ email messages per month demonstrated the average rates as follows:
| ISP | Inbox Average (%) | Spam Average (%) |
| Gmail (non-interactive) | 44,84 | 49,47 |
| GMX.com | 42,61 | 1,06 |
| Amazon Workmail | 42,16 | 0,19 |
| Exchange (Office 365) | 41,08 | 1,99 |
| G Suite (Google Workspace) | 30,49 | 62,25 |
| AOL | 24,53 | 10,87 |
| Yahoo | 24,37 | 10,84 |
| Hotmail | 24,25 | 10,88 |
| Att.net | 23,38 | 10,77 |
| Outlook | 22,54 | 11,82 |
| Zoho | 15,59 | 2,02 |
| Gmail (legacy) | 15,40 | 20,30 |
| Total | 29,27 | 16,04 |
According to our data, for senders emailing 1000+K email per month, Gmail non-interactive email addresses received the biggest part of the messages in the Inbox – 44%.
The worst deliverability for this group of senders was demonstrated by Zoho and Gmail legacy email addresses (15%).
Average Email Delivery Rates per Volume: Aggregate Table for Q2 2024
In order to better understand how the email volume impacts the email placement, we summarized the average Inbox and Spam placement ratios in the table below.
| Email Volume / Month | Inbox Average (%) | Spam Average (%) |
| 1 – 10,000 | 38,52 | 27,38 |
| 10,001 – 50,000 | 57,01 | 27,56 |
| 50,001 – 200,000 | 63,97 | 31,08 |
| 200,001 – 1,000,000 | 60,86 | 27,66 |
| 1,000,000+ | 29,27 | 16,04 |
Conclusion
To recap, here are the key takeaways we came up with after having analyzed email deliverability data for the quarter II of 2024.
Regarding the average Inbox placement and Spam folder placement ratios across all the monitored ISPS:
- the average Inbox placement ratio across all the ISPs decreased by 7%: 49% vs 56% in the quarter I of 2024;
- the average Spam folder placement ratio across the monitored ISPs decreased by 1%: 25% vs 26% in the quarter I of 2024;
- the average Spam folder replacement ratio for Google Workspace accounts increased by 10% in the quarter II of 2024: 36% vs 26% in the quarter I.
Regarding the average ratios for different groups of senders depending on the monthly volume:
- for the senders with 1 – 10K emails per month, the highest Inbox placement ratio was demonstrated by Amazon Workmail (82%) and the lowest – by AOL (20%);
- for the senders with 10K – 50K emails per month, the highest Inbox placement ratios were observed for Amazon Workmail (85%) and Office 365 (83%). The worst Inbox placement ratios were noted for AOL,Yahoo, Hotmail, and Outlook (38%);
- the senders with 50K – 200K emails per month had the best Inbox placement ratios with Amazon Workmail (98%), GMX.com (90%), and Office 365 (90%) and the worst ones with AOL and Yahoo (40%);
- large senders with 200K – 1M emails per month had the best Inbox placement ratios with Amazon Workmail (94%), GMX.com (89%), and Office 365 (79%). The lowest Inbox placement ratios for this group of senders was demonstrated by Hotmail (45%) and Outlook (40%);
- super large senders with 1M+ emails per month had the best Inbox placement ratio with the Gmail non-interactive email addresses (44%). The Gmail legacy addresses and the emails set up with Zoho showed the lowest Inbox placement ratio (15%);
- the best average Inbox placement ratio was observed for the senders with 50K – 200K per month – 63%.
We hope this report will be a good source of reference for email marketers who want to understand their deliverability compared to the average industry rates. However, it’s important to remember that deliverability is impacted by a variety of factors. Sender reputation and user engagement are one of them. It’s important for all the senders regardless of the volume and type of emails they send to be compliant with the sending rules and requirements published by the ISPs.
We encourage the senders to use GlockApps Inbox Insight tests to ensure their important email campaigns won’t be lost in the recipients’ junk folders.
Related Posts

In an attempt to secure their users from unwanted email communications, Internet service providers (ISPs) update their email filtering rules Read more

Being able to send your emails from your email system to the inbox – instead of the junk folder – Read more

Email marketing is only effective when your email communications go to the recipient’s Inbox instead of the Spam folder. Therefore, Read more

For email marketers, achieving good email deliverability is essential. It indicates the percentage of emails that successfully landed in the Read more