A DMARC Uptime Monitor verifies if the DMARC record for the given domain exists and if the existing DMARC record is correct.
To set up a DMARC uptime monitor, go to the Uptime Monitor tool and click “Create Monitor”.
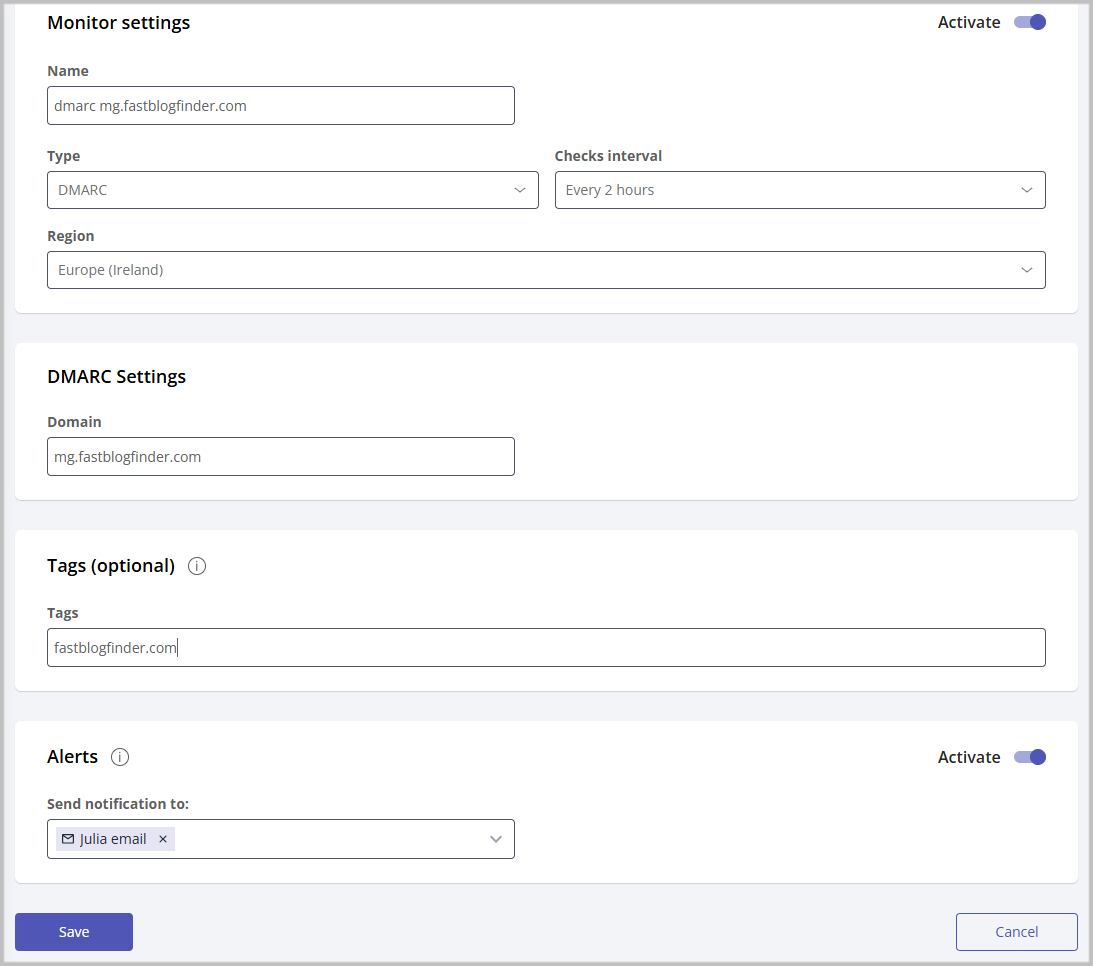
Monitor Settings
Set the “Activate” option to On and fill in the fields:
Name – enter a monitor name. It is advised to enter the type of the monitor and the domain name, for example, DMARC glockapps.co.
Type – select DMARC.
Checks Interval – select the DMARC record checking interval. Free monitors work every 2 hours. The interval for paid monitors starts with 1 minute.
Region – select the region: US East (N. Virginia) or Europe (Ireland). GlockApps uses two servers located in two regions and using different IP addresses.
SPF Settings
Domain – enter the domain name without http:// or https:// for which you want to monitor the DMARC record.
Tags
Enter a tag for the monitor (optional). Tags allow you to filter the monitors.
Alerts
Set “Activate” to On if you want to receive alerts when an issue with the DMARC record is detected.
Alerts can be sent via one or multiple channels set up in Alert Channels. The default channel is set up via email.
Select the alert channel(s) and click “Save”.
What Do the Monitor Statuses Mean?
When the monitor is working, it shows the status of the SPF record on the progressive bar.
Click on the monitor name to get a detailed report.
The meanings of the statuses are:
Up – the DMARC record exists and is correct
Down – the DMARC record doesn’t exist or is not correct
Degraded – the status changed from Up to Down
Inactive – the monitor is inactive
The Events panel provides a detailed log of the record checks. Here you can get the following information:
Event – shows the record status for the indicated date and time (Up, Down, Degraded)
Date – shows the date and time of the event (record check)
Duration – shows how much time the event status lasts. The tool shows the event status one time per day if it didn’t change. The time when the event status is shown is not fixed. It is calculated approximately. But if a new check detects the status change, it shows the new status immediately.
Response – shows the response returned by the DMARC record check.
How to Fix:
You’ll want to read the response if the current status of the DMARC record is Down or Degraded to know what you need to do to fix the issue. The common steps are:
1. Make sure the DMARC record for the domain exists in DNS.
2. Verify the syntax of the DMARC record.
3. If the DMARC record in DNS is correct, but the monitor returns an error, you’ll want to wait until the new record is propagated.